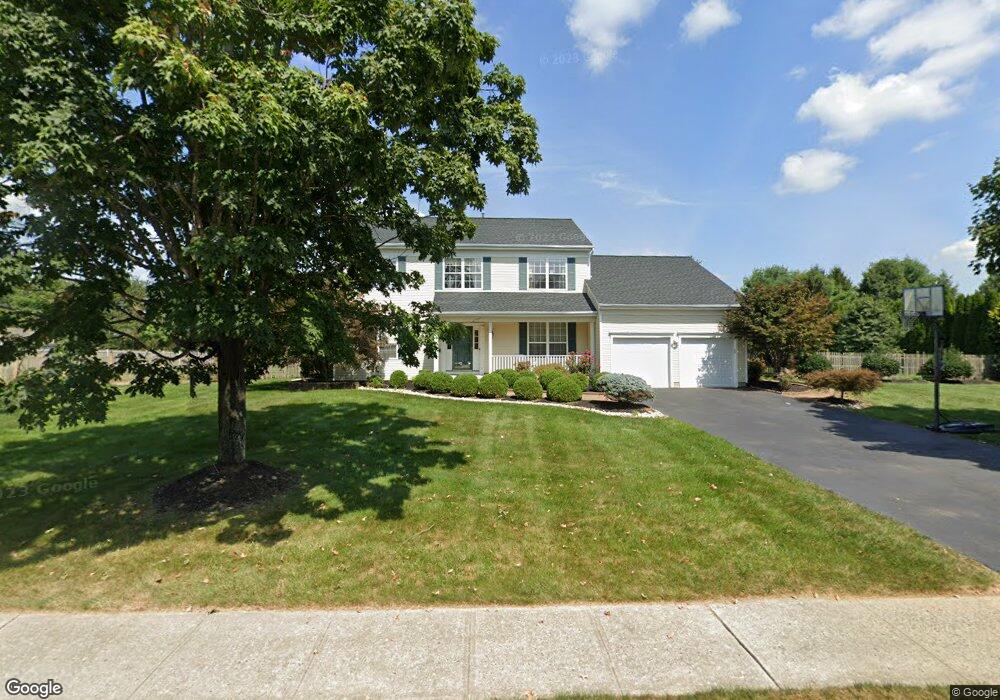
57 Cliffwood Dr Allentown, NJ 08501
Estimated Value: $869,561 - $1,044,000
4
Beds
2
Baths
2,520
Sq Ft
$376/Sq Ft
Est. Value
About This Home
This home is located at 57 Cliffwood Dr, Allentown, NJ 08501 and is currently estimated at $948,640, approximately $376 per square foot. 57 Cliffwood Dr is a home located in Monmouth County with nearby schools including Newell Elementary School, Stonebridge Middle School, and Allentown High School.
Ownership History
Date
Name
Owned For
Owner Type
Purchase Details
Closed on
Aug 15, 2018
Sold by
Kaur Pushminder and Singh Lakhvir
Bought by
Singh Harjinder and Kaur Pushminder
Current Estimated Value
Purchase Details
Closed on
Nov 10, 2003
Sold by
Distefano Thomas
Bought by
Singh Harjinder and Singh Lakhvir
Home Financials for this Owner
Home Financials are based on the most recent Mortgage that was taken out on this home.
Original Mortgage
$388,000
Interest Rate
5.98%
Purchase Details
Closed on
Mar 4, 1999
Sold by
Hovnanian K
Bought by
Destefano Thomas and Destefano Patricia
Home Financials for this Owner
Home Financials are based on the most recent Mortgage that was taken out on this home.
Original Mortgage
$227,000
Interest Rate
7.04%
Create a Home Valuation Report for This Property
The Home Valuation Report is an in-depth analysis detailing your home's value as well as a comparison with similar homes in the area
Home Values in the Area
Average Home Value in this Area
Purchase History
| Date | Buyer | Sale Price | Title Company |
|---|---|---|---|
| Singh Harjinder | -- | Mortgae Connect Lp | |
| Singh Harjinder | $485,000 | -- | |
| Destefano Thomas | $285,424 | -- |
Source: Public Records
Mortgage History
| Date | Status | Borrower | Loan Amount |
|---|---|---|---|
| Previous Owner | Singh Harjinder | $388,000 | |
| Previous Owner | Destefano Thomas | $227,000 |
Source: Public Records
Tax History Compared to Growth
Tax History
| Year | Tax Paid | Tax Assessment Tax Assessment Total Assessment is a certain percentage of the fair market value that is determined by local assessors to be the total taxable value of land and additions on the property. | Land | Improvement |
|---|---|---|---|---|
| 2025 | $14,531 | $802,600 | $260,600 | $542,000 |
| 2024 | $13,033 | $674,000 | $196,100 | $477,900 |
| 2023 | $13,033 | $586,800 | $206,100 | $380,700 |
| 2022 | $11,824 | $520,500 | $158,100 | $362,400 |
| 2021 | $11,824 | $487,600 | $212,600 | $275,000 |
| 2020 | $11,582 | $479,800 | $212,600 | $267,200 |
| 2019 | $11,522 | $480,700 | $212,600 | $268,100 |
| 2018 | $11,652 | $478,900 | $219,600 | $259,300 |
| 2017 | $11,434 | $476,200 | $219,600 | $256,600 |
| 2016 | $12,439 | $524,400 | $224,200 | $300,200 |
| 2015 | $11,270 | $480,200 | $190,200 | $290,000 |
| 2014 | $9,742 | $418,300 | $100,200 | $318,100 |
Source: Public Records
Map
Nearby Homes