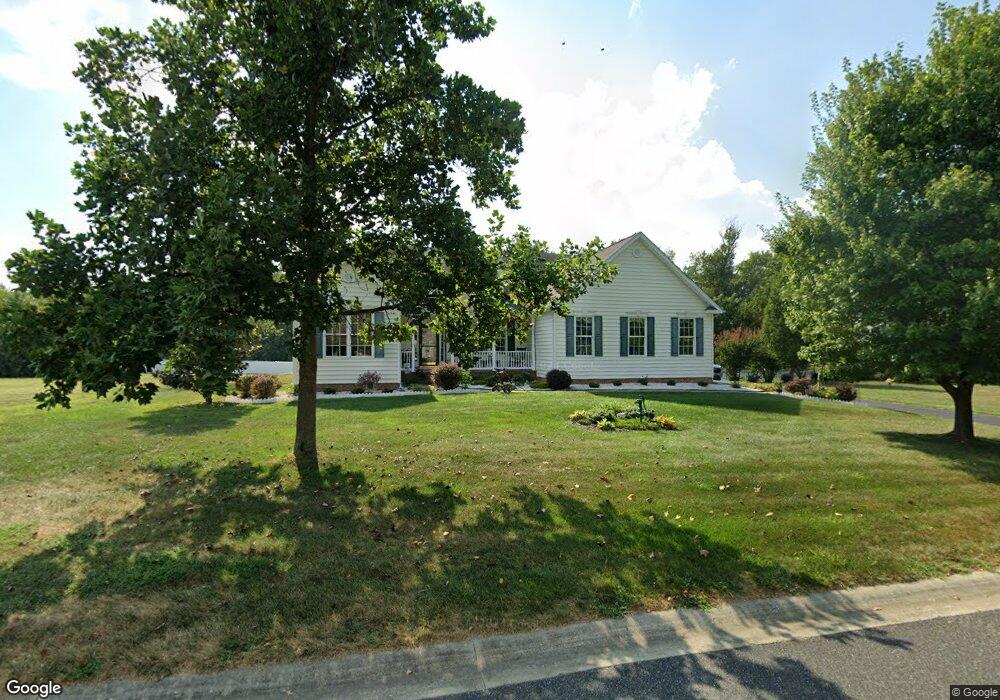
57 Cordray Ct Clayton, DE 19938
Estimated Value: $493,832 - $656,000
3
Beds
3
Baths
2,511
Sq Ft
$225/Sq Ft
Est. Value
About This Home
This home is located at 57 Cordray Ct, Clayton, DE 19938 and is currently estimated at $566,208, approximately $225 per square foot. 57 Cordray Ct is a home located in Kent County with nearby schools including Clayton Elementary School, John Bassett Moore Intermediate School, and Smyrna Middle School.
Ownership History
Date
Name
Owned For
Owner Type
Purchase Details
Closed on
Nov 17, 2010
Sold by
North State Street Properties Llc
Bought by
Price Phillip S and Price Gail S
Current Estimated Value
Purchase Details
Closed on
Apr 28, 2006
Sold by
North State Street Properies Llc
Bought by
Price Phillip S and Price Gail S
Home Financials for this Owner
Home Financials are based on the most recent Mortgage that was taken out on this home.
Original Mortgage
$368,900
Interest Rate
6.4%
Mortgage Type
Future Advance Clause Open End Mortgage
Create a Home Valuation Report for This Property
The Home Valuation Report is an in-depth analysis detailing your home's value as well as a comparison with similar homes in the area
Home Values in the Area
Average Home Value in this Area
Purchase History
| Date | Buyer | Sale Price | Title Company |
|---|---|---|---|
| Price Phillip S | -- | None Available | |
| Price Phillip S | -- | None Available |
Source: Public Records
Mortgage History
| Date | Status | Borrower | Loan Amount |
|---|---|---|---|
| Previous Owner | Price Phillip S | $368,900 |
Source: Public Records
Tax History Compared to Growth
Tax History
| Year | Tax Paid | Tax Assessment Tax Assessment Total Assessment is a certain percentage of the fair market value that is determined by local assessors to be the total taxable value of land and additions on the property. | Land | Improvement |
|---|---|---|---|---|
| 2025 | $1,911 | $473,000 | $112,700 | $360,300 |
| 2024 | $1,911 | $473,000 | $112,700 | $360,300 |
| 2023 | $1,908 | $74,600 | $6,500 | $68,100 |
| 2022 | $1,811 | $74,600 | $6,500 | $68,100 |
| 2021 | $1,865 | $74,600 | $6,500 | $68,100 |
| 2020 | $1,618 | $74,600 | $6,500 | $68,100 |
| 2019 | $1,631 | $74,600 | $6,500 | $68,100 |
| 2018 | $1,629 | $74,600 | $6,500 | $68,100 |
| 2017 | $1,627 | $74,600 | $0 | $0 |
| 2016 | $1,994 | $74,600 | $0 | $0 |
| 2015 | $2,003 | $74,600 | $0 | $0 |
| 2014 | $1,892 | $74,600 | $0 | $0 |
Source: Public Records
Map
Nearby Homes
- 5321 Millington Rd
- 63 Lord Cir
- 1151 Clayton Delaney Rd
- 106 Parma Dr
- 282 Andare Blvd
- 203 Villa Dr
- 149 Villa Dr
- 501 West St
- 410 West St
- 76 Volpe Way
- 66 N Longwood Ln
- 62 Coldwater Dr
- 8 Rehoboth Cir
- 27 Preston Ln
- 16 Clayton Dr
- 15 Clayton Dr
- 3 Clayton Dr
- 428 Christiana River Dr
- 381 Duck Creek Pkwy
- 95 Spelt Dr