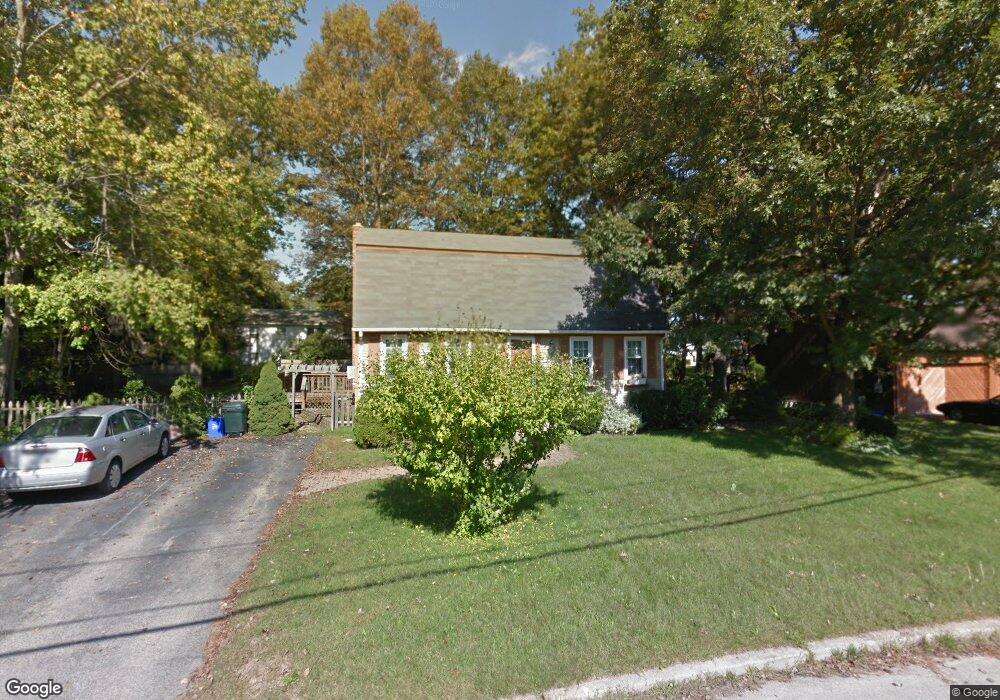
57 Cross Bow Ln West Warwick, RI 02893
Crompton NeighborhoodEstimated Value: $444,000 - $502,339
4
Beds
2
Baths
2,104
Sq Ft
$229/Sq Ft
Est. Value
About This Home
This home is located at 57 Cross Bow Ln, West Warwick, RI 02893 and is currently estimated at $482,585, approximately $229 per square foot. 57 Cross Bow Ln is a home located in Kent County with nearby schools including West Warwick High School and Father John V. Doyle School.
Ownership History
Date
Name
Owned For
Owner Type
Purchase Details
Closed on
Feb 23, 2011
Sold by
Greene Wayne A and Greene Lynn M
Bought by
James Tyler and Del Padre Angela
Current Estimated Value
Home Financials for this Owner
Home Financials are based on the most recent Mortgage that was taken out on this home.
Original Mortgage
$197,853
Outstanding Balance
$133,194
Interest Rate
4.75%
Mortgage Type
Purchase Money Mortgage
Estimated Equity
$349,391
Create a Home Valuation Report for This Property
The Home Valuation Report is an in-depth analysis detailing your home's value as well as a comparison with similar homes in the area
Home Values in the Area
Average Home Value in this Area
Purchase History
| Date | Buyer | Sale Price | Title Company |
|---|---|---|---|
| James Tyler | $203,000 | -- |
Source: Public Records
Mortgage History
| Date | Status | Borrower | Loan Amount |
|---|---|---|---|
| Open | James Tyler | $197,853 | |
| Previous Owner | James Tyler | $50,000 | |
| Previous Owner | James Tyler | $105,000 | |
| Previous Owner | James Tyler | $28,000 |
Source: Public Records
Tax History
| Year | Tax Paid | Tax Assessment Tax Assessment Total Assessment is a certain percentage of the fair market value that is determined by local assessors to be the total taxable value of land and additions on the property. | Land | Improvement |
|---|---|---|---|---|
| 2025 | $6,433 | $450,200 | $114,500 | $335,700 |
| 2024 | $5,917 | $316,600 | $90,400 | $226,200 |
| 2023 | $5,800 | $316,600 | $90,400 | $226,200 |
| 2022 | $5,656 | $313,500 | $90,400 | $223,100 |
| 2021 | $5,667 | $246,400 | $72,300 | $174,100 |
| 2020 | $5,667 | $246,400 | $72,300 | $174,100 |
| 2019 | $7,224 | $246,400 | $72,300 | $174,100 |
| 2018 | $5,151 | $189,500 | $70,200 | $119,300 |
| 2017 | $4,986 | $189,500 | $70,200 | $119,300 |
| 2016 | $4,897 | $189,500 | $70,200 | $119,300 |
| 2015 | $4,948 | $190,600 | $70,200 | $120,400 |
| 2014 | $1,210 | $190,600 | $70,200 | $120,400 |
Source: Public Records
Map
Nearby Homes
- 16 Drawbridge Dr
- 0 New London Turnpike
- 25 Wescott Way Unit 80
- 1 Hampton Rd Unit 27
- 15 Hampton Rd Unit 20
- 19 Hampton Rd Unit 69
- 40 Wescott Way Unit 57
- 19 Turner Dr
- 1785 Division Rd
- 11 Kennedy Dr
- 57 Setian Ln
- 6 Field Ave
- 76 Tiogue Ave
- 35 Beech Crest Rd
- 275 E Shore Dr
- 251 E Shore Dr
- 25 Rock Way
- 2545 Division Rd
- 500 E Greenwich Ave Unit 124
- 22 Rawlinson Dr
Your Personal Tour Guide
Ask me questions while you tour the home.