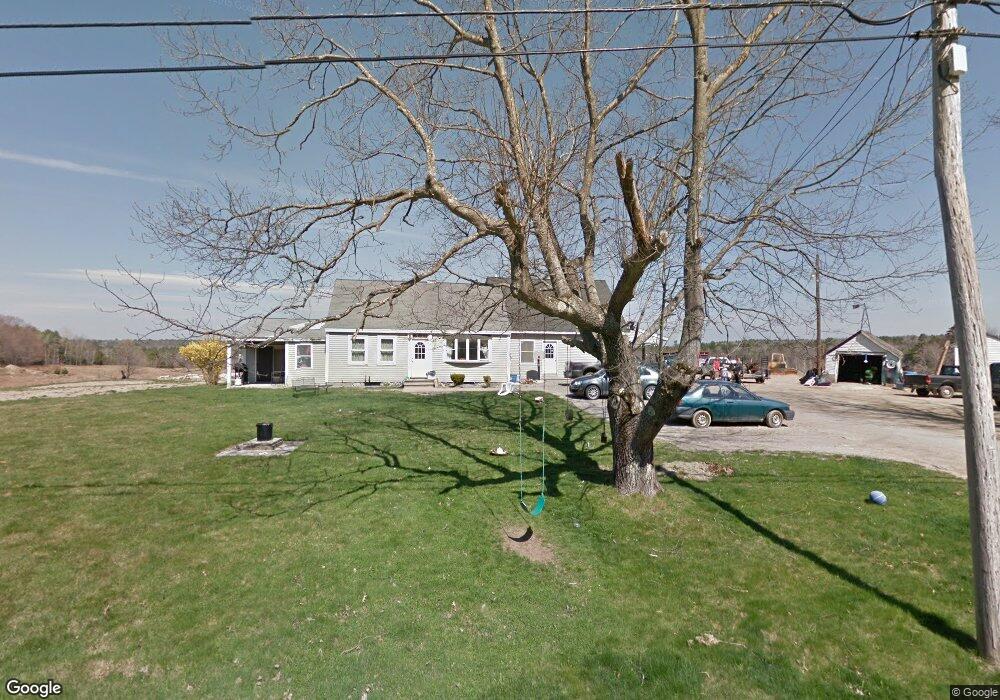
57 Curtis Rd Freeport, ME 04032
Estimated Value: $504,642 - $601,000
4
Beds
1
Bath
2,016
Sq Ft
$272/Sq Ft
Est. Value
About This Home
This home is located at 57 Curtis Rd, Freeport, ME 04032 and is currently estimated at $548,661, approximately $272 per square foot. 57 Curtis Rd is a home with nearby schools including Morse Street School, Mast Landing School, and Freeport Middle School.
Ownership History
Date
Name
Owned For
Owner Type
Purchase Details
Closed on
Mar 29, 2021
Sold by
Seymour Paul J
Bought by
Seymour Arianne
Current Estimated Value
Purchase Details
Closed on
Mar 19, 2021
Sold by
Seymour Paul J
Bought by
Seymour Paul J
Purchase Details
Closed on
Nov 20, 2019
Sold by
Seymour Paul J
Bought by
Seymour Paul J
Purchase Details
Closed on
Mar 23, 2005
Sold by
Seymour Paul J
Bought by
Seymour Paul J and Macmillan Melody R
Create a Home Valuation Report for This Property
The Home Valuation Report is an in-depth analysis detailing your home's value as well as a comparison with similar homes in the area
Home Values in the Area
Average Home Value in this Area
Purchase History
| Date | Buyer | Sale Price | Title Company |
|---|---|---|---|
| Seymour Arianne | -- | None Available | |
| Seymour Paul J | -- | None Available | |
| Seymour Paul J | -- | -- | |
| Seymour Paul J | -- | -- |
Source: Public Records
Tax History Compared to Growth
Tax History
| Year | Tax Paid | Tax Assessment Tax Assessment Total Assessment is a certain percentage of the fair market value that is determined by local assessors to be the total taxable value of land and additions on the property. | Land | Improvement |
|---|---|---|---|---|
| 2024 | $4,654 | $348,600 | $133,100 | $215,500 |
| 2023 | $4,238 | $308,200 | $120,900 | $187,300 |
| 2022 | $4,047 | $296,500 | $109,200 | $187,300 |
| 2021 | $3,958 | $296,500 | $109,200 | $187,300 |
| 2020 | $3,870 | $276,400 | $101,100 | $175,300 |
| 2019 | $3,715 | $259,800 | $95,400 | $164,400 |
| 2018 | $3,570 | $245,600 | $87,200 | $158,400 |
| 2017 | $3,533 | $236,300 | $85,200 | $151,100 |
| 2016 | $3,490 | $220,900 | $80,700 | $140,200 |
| 2015 | $3,913 | $232,900 | $77,300 | $155,600 |
| 2014 | $3,045 | $192,700 | $77,300 | $115,400 |
| 2013 | $3,050 | $192,400 | $75,900 | $116,500 |
Source: Public Records
Map
Nearby Homes
- 42A Wardtown Rd
- 3 Ron Henry Ln
- 140 Grant Rd
- 1 Fawn Meadow Ln
- 143 Bragdon Rd
- 134 Durham Rd
- 137 Durham Rd
- 12 Peter Robin Way
- 7 Hideaway Dr
- 127 Brown Rd
- Lot #3 Fernwood Dr
- 1595 U S Route 1
- 713 Old Portland Rd
- Lot #2 Collinsbrook Rd
- 1260 Us Route 1
- 31 Allen Range Rd
- 0 Prout Rd
- 4 Harper's Trail
- 15 Tinkers Way
- 10 Durham Rd