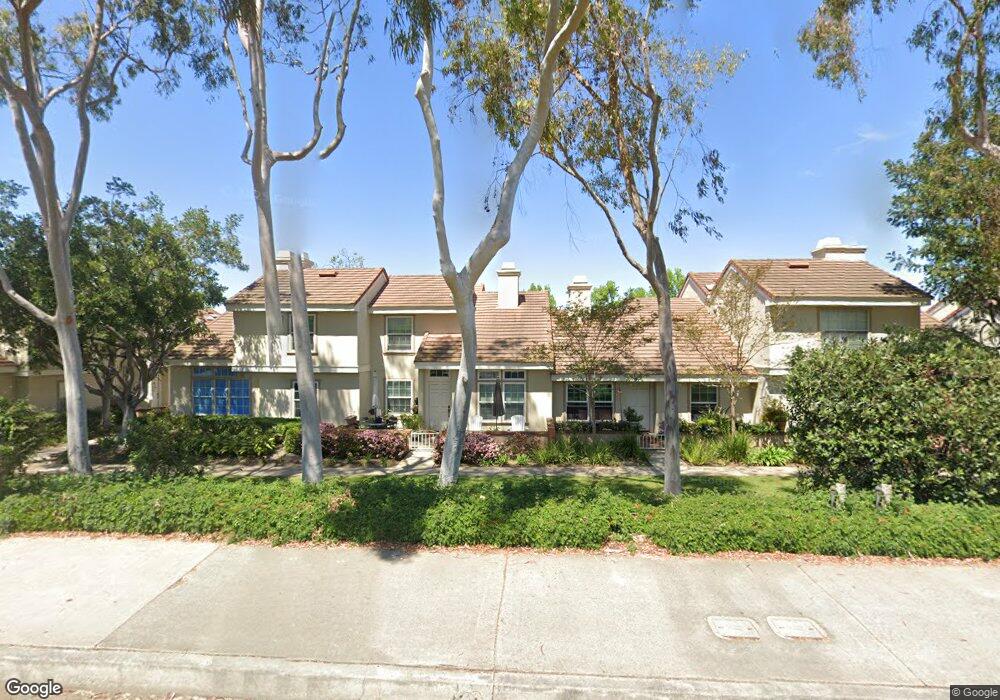
57 Dartmouth Irvine, CA 92612
University Park and Town Center NeighborhoodEstimated Value: $1,159,260 - $1,330,000
2
Beds
2
Baths
1,447
Sq Ft
$869/Sq Ft
Est. Value
About This Home
This home is located at 57 Dartmouth, Irvine, CA 92612 and is currently estimated at $1,258,065, approximately $869 per square foot. 57 Dartmouth is a home located in Orange County with nearby schools including Turtle Rock Elementary, Rancho San Joaquin Middle School, and University High School.
Ownership History
Date
Name
Owned For
Owner Type
Purchase Details
Closed on
Aug 21, 2009
Sold by
Wehner Michael P and Wehner Karen O
Bought by
Wehner Michael P and Wehner Karen O
Current Estimated Value
Purchase Details
Closed on
Dec 2, 1997
Sold by
Robert Whiting
Bought by
Wehner Michael P and Wehner Karen O
Home Financials for this Owner
Home Financials are based on the most recent Mortgage that was taken out on this home.
Original Mortgage
$115,000
Interest Rate
7.23%
Purchase Details
Closed on
Aug 31, 1994
Sold by
Carrico Alan A and Carrico Laurie J
Bought by
Whiting Robert K
Home Financials for this Owner
Home Financials are based on the most recent Mortgage that was taken out on this home.
Original Mortgage
$168,300
Interest Rate
8.61%
Create a Home Valuation Report for This Property
The Home Valuation Report is an in-depth analysis detailing your home's value as well as a comparison with similar homes in the area
Home Values in the Area
Average Home Value in this Area
Purchase History
| Date | Buyer | Sale Price | Title Company |
|---|---|---|---|
| Wehner Michael P | -- | None Available | |
| Wehner Michael P | $180,000 | Lawyers Title Company | |
| Whiting Robert K | $187,000 | South Coast Title Company |
Source: Public Records
Mortgage History
| Date | Status | Borrower | Loan Amount |
|---|---|---|---|
| Previous Owner | Wehner Michael P | $115,000 | |
| Previous Owner | Whiting Robert K | $168,300 |
Source: Public Records
Tax History Compared to Growth
Tax History
| Year | Tax Paid | Tax Assessment Tax Assessment Total Assessment is a certain percentage of the fair market value that is determined by local assessors to be the total taxable value of land and additions on the property. | Land | Improvement |
|---|---|---|---|---|
| 2025 | $3,066 | $287,402 | $119,757 | $167,645 |
| 2024 | $3,066 | $281,767 | $117,409 | $164,358 |
| 2023 | $2,987 | $276,243 | $115,107 | $161,136 |
| 2022 | $2,933 | $270,827 | $112,850 | $157,977 |
| 2021 | $2,868 | $265,517 | $110,637 | $154,880 |
| 2020 | $2,851 | $262,795 | $109,503 | $153,292 |
| 2019 | $2,788 | $257,643 | $107,356 | $150,287 |
| 2018 | $2,737 | $252,592 | $105,251 | $147,341 |
| 2017 | $2,680 | $247,640 | $103,188 | $144,452 |
| 2016 | $2,563 | $242,785 | $101,165 | $141,620 |
| 2015 | $2,524 | $239,139 | $99,646 | $139,493 |
| 2014 | $2,476 | $234,455 | $97,694 | $136,761 |
Source: Public Records
Map
Nearby Homes
- 17 Oxford Unit 28
- 53 Wellesley Unit 50
- 16 Wellesley Unit 2
- 4886 Paseo de Vega
- 18802 Saginaw Dr
- 18816 Saginaw Dr
- 5231 Hiram Ln
- 14 Scripps Aisle Unit 173
- 6 Mandrake Way
- 18 Solana
- 10 Lassen
- 17 Verde Unit 23
- 18 Meadowsweet Way
- 19112 Biddle Dr
- 22 Meadowsweet Way
- 21 Faith
- 3 Palos Unit 51
- 21 Rustling Wind
- 3 Whitewood Way
- 9 Flores
- 57 Dartmouth Unit 51
- 59 Dartmouth Unit 52
- 53 Dartmouth Unit 49
- 53 Dartmouth
- 61 Dartmouth
- 51 Dartmouth Unit 48
- 51 Dartmouth
- 47 Dartmouth Unit 46
- 49 Dartmouth Unit 47
- 49 Dartmouth
- 65 Dartmouth
- 67 Dartmouth Unit 64
- 67 Dartmouth
- 45 Dartmouth Unit 37
- 69 Dartmouth Unit 65
- 41 Dartmouth Unit 39
- 36 Oxford Unit 41
- 55 Dartmouth
- 39 Dartmouth Unit 40
- 39 Dartmouth