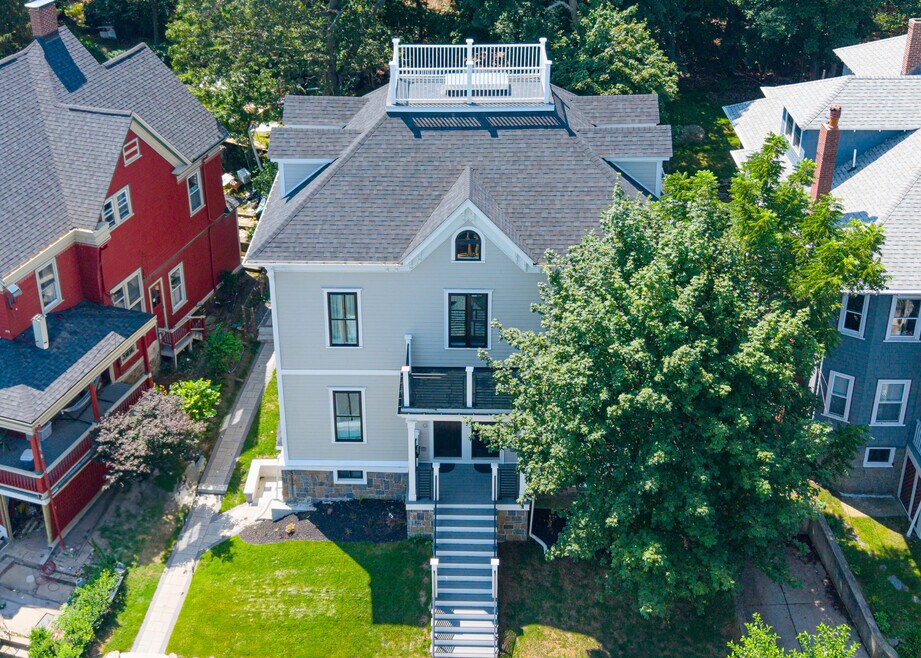
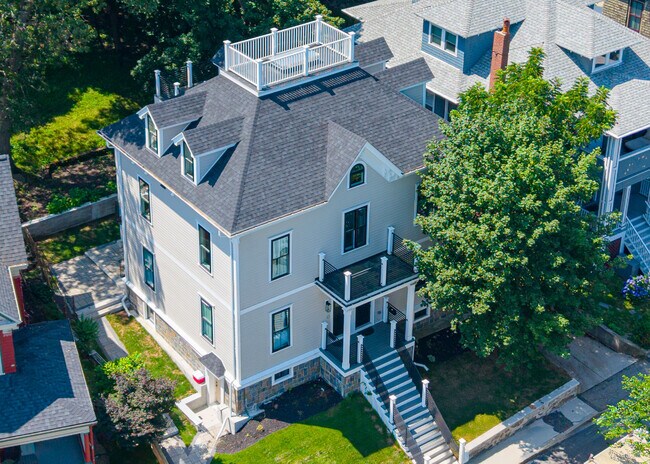
57 Grampian Way Dorchester, MA 02125
Savin Hill NeighborhoodAbout This Home
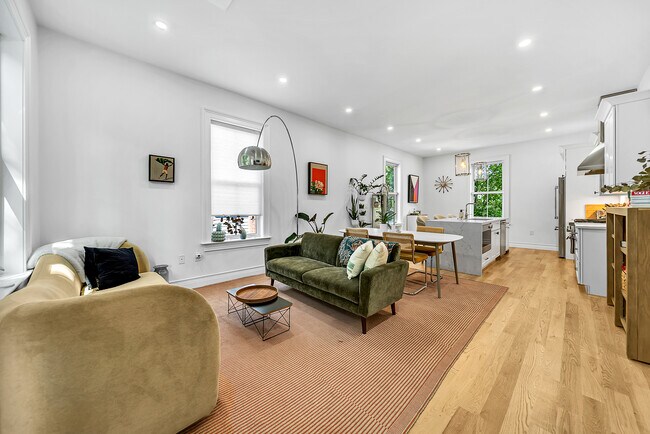
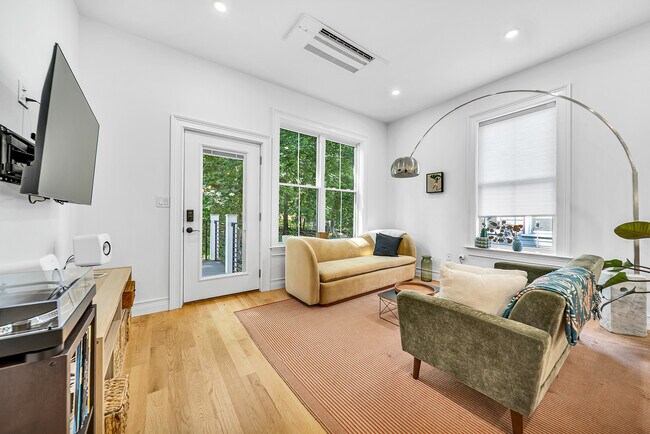
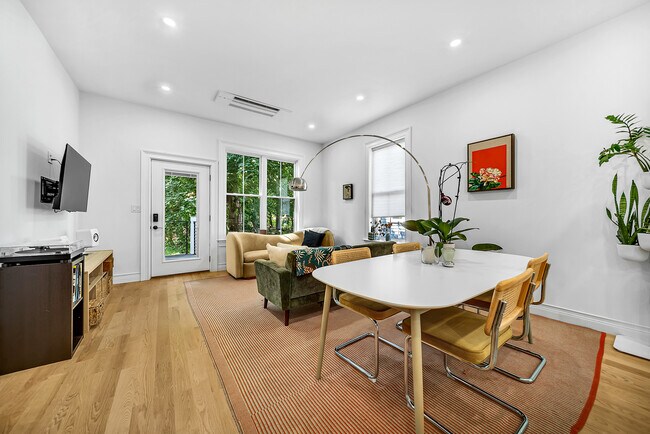
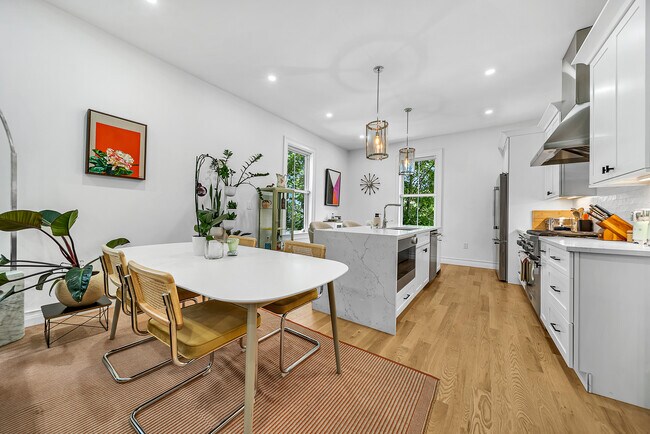
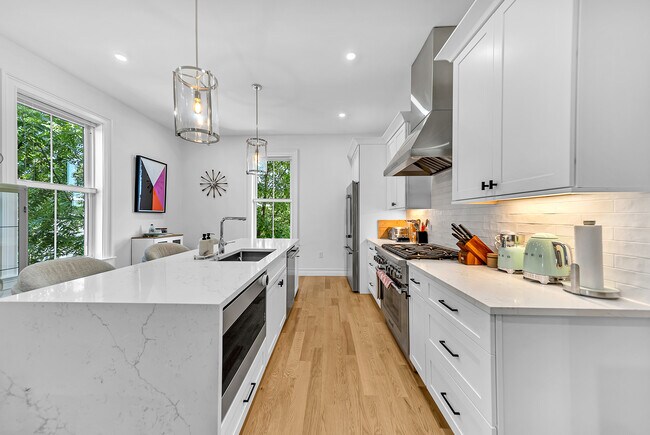
PRIVATE ROOM- $1,400- Available Now! This beautifully renovated modern townhouse on Grampian Way, in the highly sought-after "Over the Bridge" neighborhood of Savin Hill, is perfect for renters seeking both style and convenience. Featuring high ceilings, large picture windows, and a private patio, this home offers a sleek, contemporary design. The walk-out lower level adds extra living space and easy access. Nestled next to Savin Hill Park and just a short walk from the Red Line T station, you'll be moments away from local dining, beaches, yacht clubs, the Daily Market, The Beat, and UMASS Boston. Undergoing a 2024 renovation, this 2,070 sq. ft. townhouse is being fully rebuilt with modern updates, including closed-cell insulation, brand-new electrical, plumbing, heating, and cooling systems, as well as new siding, roofing, and hardwood floors. The property also boasts a new stone patio and shared yard space for outdoor enjoyment. The kitchen is equipped with top-of-the-line Thermador appliances, a sleek stainless steel center island, and an open-concept dining and living area perfect for entertaining. Luxurious bathrooms feature high-end finishes for a modern touch, and in-unit laundry makes daily living a breeze. A one-year lease is required. Applicants must have good credit, strong references, and a solid income to qualify for this luxury rental opportunity.

Map
Property History
| Date | Event | Price | List to Sale | Price per Sq Ft |
|---|---|---|---|---|
| 10/13/2025 10/13/25 | Price Changed | $1,400 | 0.0% | $7 / Sq Ft |
| 10/13/2025 10/13/25 | For Rent | $1,400 | -74.1% | -- |
| 08/24/2025 08/24/25 | Off Market | $5,400 | -- | -- |
| 07/21/2025 07/21/25 | For Rent | $5,400 | -- | -- |
- 42 Grampian Way
- 243 D Savin Hill Ave
- 79 Sydney St
- 9 Sydney St Unit 301
- 9 Sydney St Unit 202
- 9 Sydney St Unit 1
- 141 Savin Hill Ave Unit C23
- 72 Tuttle St Unit 3
- 46 Saxton St
- 84 Romsey St Unit 3
- 58 Saxton St Unit 2
- 4 Saxton St
- 74-76 Sudan St Unit 1
- 9 Hallam St Unit 3
- 17 Spring Garden St
- 8 Spring Garden St Unit 3
- 11 Savin Hill Ave
- 10 Grant St
- 33 Pearl St Unit 3
- 33 Pearl St Unit 1
- 56 Grampian Way
- 72 Grampian Way Unit 2
- 324 Savin Hill Ave Unit 2
- 369 Savin Hill Ave Unit 2
- 10 Wave Ave Unit 2
- 18 Grampian Way Unit 1
- 131 Grampian Way Unit 2
- 16 Grampian Way Unit 1
- 152 Savin Hill Ave Unit 1
- 247 Savin Hill Ave
- 247 Savin Hill Ave Unit 2
- 141 Savin Hill Ave Unit A22
- 43 Sydney St Unit 2
- 21 Sydney St Unit 2
- 19 Playstead Rd Unit A
- 19 Playstead Rd Unit 3
- 17 Playstead Rd Unit 4-bed2-bath
- 235 Savin Hill Ave Unit 1L
- 18 Denny St
- 79 Sydney St Unit 3