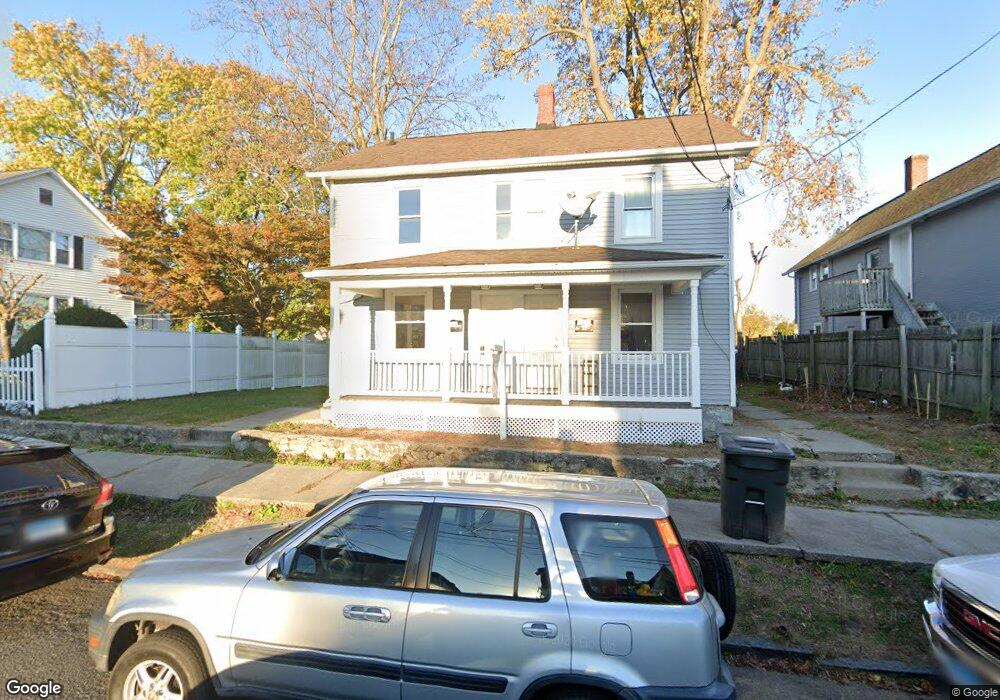
57 Griffing Ave Danbury, CT 06810
Estimated Value: $378,297 - $607,000
4
Beds
2
Baths
1,450
Sq Ft
$361/Sq Ft
Est. Value
About This Home
This home is located at 57 Griffing Ave, Danbury, CT 06810 and is currently estimated at $523,574, approximately $361 per square foot. 57 Griffing Ave is a home located in Fairfield County with nearby schools including Ellsworth Avenue School, Broadview Middle School, and Danbury High School.
Ownership History
Date
Name
Owned For
Owner Type
Purchase Details
Closed on
Dec 9, 2020
Sold by
Correira Jamie L and Barese Richard
Bought by
Griffing Ave Partners Llc
Current Estimated Value
Purchase Details
Closed on
Jan 13, 2006
Sold by
Mtg Guaranty Insurance
Bought by
Correia Jamie and Barese Richard
Home Financials for this Owner
Home Financials are based on the most recent Mortgage that was taken out on this home.
Original Mortgage
$252,000
Interest Rate
6.28%
Mortgage Type
Purchase Money Mortgage
Purchase Details
Closed on
Apr 22, 2003
Sold by
Fuentes Jose and Fuentes Liliana
Bought by
John Daniel
Purchase Details
Closed on
Nov 21, 2001
Sold by
Able Jack
Bought by
Fuentes Jose and Fuentes Liliana
Create a Home Valuation Report for This Property
The Home Valuation Report is an in-depth analysis detailing your home's value as well as a comparison with similar homes in the area
Home Values in the Area
Average Home Value in this Area
Purchase History
| Date | Buyer | Sale Price | Title Company |
|---|---|---|---|
| Griffing Ave Partners Llc | $255,000 | None Available | |
| Griffing Ave Partners Llc | $255,000 | None Available | |
| Correia Jamie | $280,000 | -- | |
| Mtg Guaranty Insurance | $275,175 | -- | |
| Mtg Guaranty Insurance | $275,175 | -- | |
| John Daniel | $262,000 | -- | |
| John Daniel | $262,000 | -- | |
| Fuentes Jose | $91,000 | -- | |
| Fuentes Jose | $91,000 | -- | |
| Fuentes Jose | $91,000 | -- |
Source: Public Records
Mortgage History
| Date | Status | Borrower | Loan Amount |
|---|---|---|---|
| Previous Owner | Fuentes Jose | $255,000 | |
| Previous Owner | Fuentes Jose | $252,000 | |
| Previous Owner | Fuentes Jose | $0 |
Source: Public Records
Tax History
| Year | Tax Paid | Tax Assessment Tax Assessment Total Assessment is a certain percentage of the fair market value that is determined by local assessors to be the total taxable value of land and additions on the property. | Land | Improvement |
|---|---|---|---|---|
| 2025 | $5,430 | $217,280 | $58,380 | $158,900 |
| 2024 | $5,310 | $217,280 | $58,380 | $158,900 |
| 2023 | $5,069 | $217,280 | $58,380 | $158,900 |
| 2022 | $4,131 | $146,400 | $60,400 | $86,000 |
| 2021 | $4,041 | $146,400 | $60,400 | $86,000 |
| 2020 | $4,041 | $146,400 | $60,400 | $86,000 |
| 2019 | $4,041 | $146,400 | $60,400 | $86,000 |
| 2018 | $4,041 | $146,400 | $60,400 | $86,000 |
| 2017 | $3,295 | $113,800 | $57,500 | $56,300 |
| 2016 | $3,264 | $113,800 | $57,500 | $56,300 |
| 2015 | $3,216 | $113,800 | $57,500 | $56,300 |
| 2014 | $3,141 | $113,800 | $57,500 | $56,300 |
Source: Public Records
Map
Nearby Homes
- 63 Brentwood Cir Unit 63
- 1 Brentwood Cir Unit 1
- 424 Center Meadow Ln Unit 424
- 185 Brentwood Cir Unit 185
- 1 Union Ave Unit 11
- 68 Virginia Ave Unit 11
- 5 -7-9 Patch St
- 63A Main St
- 68 Rowan St
- 23 Franklin St Unit 1
- 9 Farview Ave Unit 3-12
- 19 Mcdermott St
- 31-33 Wildman St
- 8 Ann Dr Unit B
- 37 Taylor St
- 35 Taylor St
- 15-17 Boughton St Unit 1-6
- 38 Padanaram Ave Unit 1
- 51 Wildman St Unit 305
- 26 Walden Ct Unit Lot 6
- 5-7 Griffing Ave
- 3 Griffing Ave
- 9 Griffing Ave
- 39 Osborne St
- 37 Osborne St
- 11 Griffing Ave
- 4 Griffing Ave
- 35-37 Osborne St
- 35 Osborne St Unit 37
- 35 Osborne St Unit 2
- 35 Osborne St Unit 4
- 41 Osborne St
- 33 Osborne St
- 6 Griffing Ave
- 8 Griffing Ave
- 10 Griffing Ave Unit 3
- 10 Griffing Ave Unit 2
- 10 Griffing Ave Unit 1
- 10 Griffing Ave Unit C
- 10 Griffing Ave Unit B
Your Personal Tour Guide
Ask me questions while you tour the home.