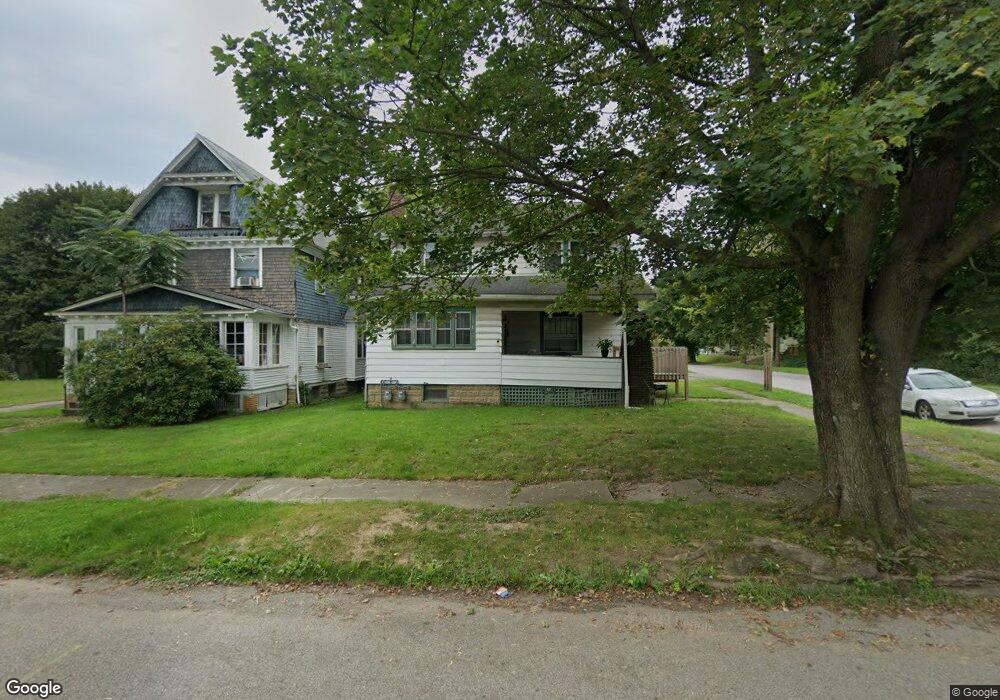
57 Halls Heights Ave Youngstown, OH 44509
Schenley NeighborhoodEstimated Value: $106,000 - $114,140
5
Beds
3
Baths
2,343
Sq Ft
$47/Sq Ft
Est. Value
About This Home
This home is located at 57 Halls Heights Ave, Youngstown, OH 44509 and is currently estimated at $110,285, approximately $47 per square foot. 57 Halls Heights Ave is a home located in Mahoning County with nearby schools including Kirkmere Elementary School, Chaney High School, and Summit Academy - Youngstown.
Ownership History
Date
Name
Owned For
Owner Type
Purchase Details
Closed on
Mar 9, 2025
Sold by
Cj And Cj Holdings Llc
Bought by
Rawls Legacy Holdings Llc
Current Estimated Value
Home Financials for this Owner
Home Financials are based on the most recent Mortgage that was taken out on this home.
Original Mortgage
$88,000
Outstanding Balance
$87,540
Interest Rate
6.76%
Mortgage Type
New Conventional
Estimated Equity
$22,745
Purchase Details
Closed on
May 9, 2022
Sold by
Heartland Property Group Llc
Bought by
Cj And Cj Holdings Llc
Purchase Details
Closed on
Jun 15, 2020
Sold by
Papas Charles J
Bought by
Heartland Property Group Llc
Purchase Details
Closed on
May 31, 1994
Bought by
Papas Peter E and Papas Charles J
Create a Home Valuation Report for This Property
The Home Valuation Report is an in-depth analysis detailing your home's value as well as a comparison with similar homes in the area
Home Values in the Area
Average Home Value in this Area
Purchase History
| Date | Buyer | Sale Price | Title Company |
|---|---|---|---|
| Rawls Legacy Holdings Llc | $110,000 | None Listed On Document | |
| Rawls Legacy Holdings Llc | $110,000 | None Listed On Document | |
| Cj And Cj Holdings Llc | $75,000 | None Listed On Document | |
| Cj And Cj Holdings Llc | $75,000 | None Listed On Document | |
| Heartland Property Group Llc | $90,000 | None Available | |
| Papas Peter E | $31,000 | -- |
Source: Public Records
Mortgage History
| Date | Status | Borrower | Loan Amount |
|---|---|---|---|
| Open | Rawls Legacy Holdings Llc | $88,000 | |
| Closed | Rawls Legacy Holdings Llc | $88,000 |
Source: Public Records
Tax History Compared to Growth
Tax History
| Year | Tax Paid | Tax Assessment Tax Assessment Total Assessment is a certain percentage of the fair market value that is determined by local assessors to be the total taxable value of land and additions on the property. | Land | Improvement |
|---|---|---|---|---|
| 2024 | $1,084 | $22,180 | $1,290 | $20,890 |
| 2023 | $1,077 | $22,180 | $1,290 | $20,890 |
| 2022 | $615 | $9,730 | $1,270 | $8,460 |
| 2021 | $615 | $9,730 | $1,270 | $8,460 |
| 2020 | $618 | $9,730 | $1,270 | $8,460 |
| 2019 | $607 | $8,540 | $1,120 | $7,420 |
| 2018 | $613 | $8,540 | $1,120 | $7,420 |
| 2017 | $610 | $8,540 | $1,120 | $7,420 |
| 2016 | $675 | $10,170 | $1,720 | $8,450 |
| 2015 | $661 | $10,170 | $1,720 | $8,450 |
| 2014 | $656 | $10,170 | $1,720 | $8,450 |
| 2013 | $648 | $10,170 | $1,720 | $8,450 |
Source: Public Records
Map
Nearby Homes
- 112 Glacier Ave
- 120 Whitney Ave S
- 1595 2nd St
- 1594 2nd St
- 60 Steel St
- 1651 Price Rd
- 15 S Portland Ave
- 1751 Mahoning Ave
- 234 S Portland Ave
- 1611 Wellington Ave
- 1711 Wellington Ave
- 219 N Maryland Ave
- 77 Fernwood Ave
- 1516 Midland Ave
- 1726 Midland Ave
- 2005 Chaney Cir
- 134 Millet Ave
- 1639 Butler Ave
- 115 N Richview Ave
- 1947 Manhattan Ave
- 53 Halls Heights Ave
- 49 Halls Heights Ave
- 1510 Hillsdale Ave
- 103 Halls Heights Ave
- 1501 Hillsdale Ave
- 50 Whitney Ave S
- 43 Halls Heights Ave
- 109 Halls Heights Ave
- 56 Whitney Ave S
- 46 Whitney Ave S
- 96 Halls Heights Ave
- 54 Halls Heights Ave Unit 56
- 66 Whitney Ave S
- 104 Halls Heights Ave
- 50 Halls Heights Ave
- 42 Whitney Ave S
- 39 Halls Heights Ave
- 113 Halls Heights Ave
- 44 Halls Heights Ave
- 110 Halls Heights Ave