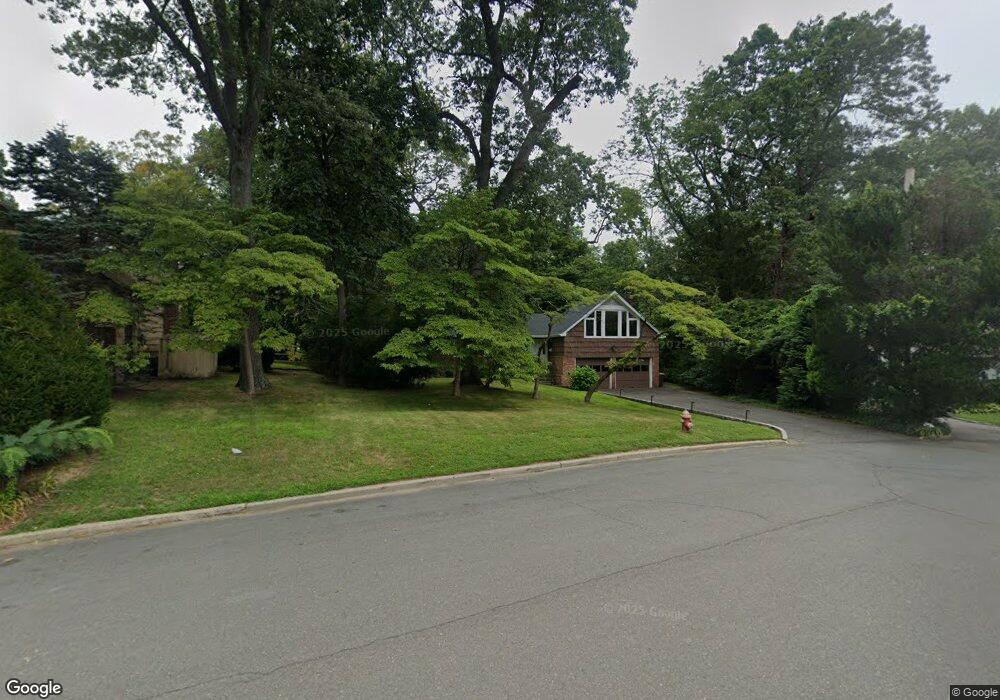
57 Harwood Dr E Glen Cove, NY 11542
Estimated Value: $765,000 - $849,916
--
Bed
--
Bath
2,773
Sq Ft
$291/Sq Ft
Est. Value
About This Home
This home is located at 57 Harwood Dr E, Glen Cove, NY 11542 and is currently estimated at $807,458, approximately $291 per square foot. 57 Harwood Dr E is a home with nearby schools including Robert M Finley Middle School, Glen Cove High School, and Tiegerman Elementary School.
Ownership History
Date
Name
Owned For
Owner Type
Purchase Details
Closed on
Aug 12, 2021
Sold by
Paul A Nuccio and Lawrence Nuccio Jr Estate
Bought by
Padilla Jason and Nuccio Danielle
Current Estimated Value
Home Financials for this Owner
Home Financials are based on the most recent Mortgage that was taken out on this home.
Original Mortgage
$545,000
Outstanding Balance
$494,503
Interest Rate
2.9%
Mortgage Type
New Conventional
Estimated Equity
$312,955
Create a Home Valuation Report for This Property
The Home Valuation Report is an in-depth analysis detailing your home's value as well as a comparison with similar homes in the area
Home Values in the Area
Average Home Value in this Area
Purchase History
| Date | Buyer | Sale Price | Title Company |
|---|---|---|---|
| Padilla Jason | $585,000 | Chicago Title | |
| Padilla Jason | $585,000 | Chicago Title | |
| Padilla Jason | $585,000 | Chicago Title |
Source: Public Records
Mortgage History
| Date | Status | Borrower | Loan Amount |
|---|---|---|---|
| Open | Padilla Jason | $545,000 | |
| Closed | Padilla Jason | $545,000 |
Source: Public Records
Tax History Compared to Growth
Tax History
| Year | Tax Paid | Tax Assessment Tax Assessment Total Assessment is a certain percentage of the fair market value that is determined by local assessors to be the total taxable value of land and additions on the property. | Land | Improvement |
|---|---|---|---|---|
| 2025 | $1,169 | $614 | $283 | $331 |
| 2024 | $1,176 | $614 | $283 | $331 |
| 2023 | $3,903 | $630 | $290 | $340 |
| 2022 | $1,073 | $614 | $283 | $331 |
| 2021 | $10,605 | $624 | $297 | $327 |
| 2020 | $11,144 | $589 | $543 | $46 |
| 2019 | $3,541 | $631 | $546 | $85 |
| 2018 | $769 | $673 | $0 | $0 |
| 2017 | $769 | $715 | $550 | $165 |
| 2016 | $769 | $757 | $524 | $233 |
| 2015 | $673 | $799 | $553 | $246 |
| 2014 | $673 | $799 | $553 | $246 |
| 2013 | $662 | $841 | $582 | $259 |
Source: Public Records
Map
Nearby Homes