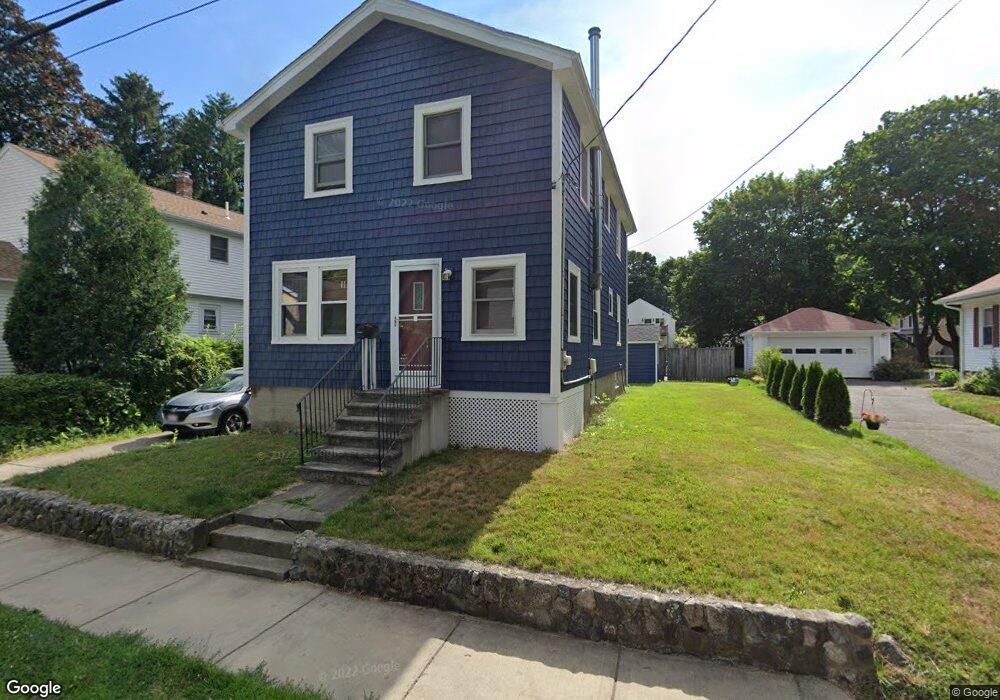
57 High St Natick, MA 01760
Estimated Value: $786,000 - $926,000
3
Beds
2
Baths
1,672
Sq Ft
$500/Sq Ft
Est. Value
About This Home
This home is located at 57 High St, Natick, MA 01760 and is currently estimated at $835,204, approximately $499 per square foot. 57 High St is a home located in Middlesex County with nearby schools including Natick High School, Johnson Elementary School, and J F Kennedy Middle School.
Ownership History
Date
Name
Owned For
Owner Type
Purchase Details
Closed on
Feb 1, 1989
Sold by
Dunlop Margaret J
Bought by
Dunlop Albert J
Current Estimated Value
Home Financials for this Owner
Home Financials are based on the most recent Mortgage that was taken out on this home.
Original Mortgage
$105,000
Interest Rate
10.62%
Mortgage Type
Purchase Money Mortgage
Create a Home Valuation Report for This Property
The Home Valuation Report is an in-depth analysis detailing your home's value as well as a comparison with similar homes in the area
Home Values in the Area
Average Home Value in this Area
Purchase History
| Date | Buyer | Sale Price | Title Company |
|---|---|---|---|
| Dunlop Albert J | $140,000 | -- |
Source: Public Records
Mortgage History
| Date | Status | Borrower | Loan Amount |
|---|---|---|---|
| Open | Dunlop Albert J | $135,000 | |
| Closed | Dunlop Albert J | $131,250 | |
| Closed | Dunlop Albert J | $23,000 | |
| Closed | Dunlop Albert J | $105,000 |
Source: Public Records
Tax History
| Year | Tax Paid | Tax Assessment Tax Assessment Total Assessment is a certain percentage of the fair market value that is determined by local assessors to be the total taxable value of land and additions on the property. | Land | Improvement |
|---|---|---|---|---|
| 2025 | $8,392 | $701,700 | $423,200 | $278,500 |
| 2024 | $8,120 | $662,300 | $399,600 | $262,700 |
| 2023 | $7,939 | $628,100 | $376,100 | $252,000 |
| 2022 | $7,658 | $574,100 | $343,200 | $230,900 |
| 2021 | $7,396 | $543,400 | $324,400 | $219,000 |
| 2020 | $6,367 | $467,800 | $296,200 | $171,600 |
| 2019 | $5,946 | $467,800 | $296,200 | $171,600 |
| 2018 | $5,756 | $441,100 | $282,100 | $159,000 |
| 2017 | $5,315 | $394,000 | $249,200 | $144,800 |
| 2016 | $5,129 | $378,000 | $234,500 | $143,500 |
| 2015 | $5,061 | $366,200 | $234,500 | $131,700 |
Source: Public Records
Map
Nearby Homes
- 25 Forest Ave
- 6 Floral Avenue Extension
- 5 Reynolds Ave Unit 2
- 62 Oakland St
- 216-218 S Main St
- 12 Floral Ave
- 16 West St
- 14 Pinewood Ave
- 63 Pond St
- 7 High St
- 89 W Central St
- 49 Summer St
- 45 Summer St
- 9 Bellevue Rd
- 11 Avon St
- 10 Lincoln St Unit 10
- 6A Lincoln St Unit 6A
- 4B Lincoln St Unit 4B
- 3A Wilson St Unit 3A
- 3 Wilson St Unit 3B
Your Personal Tour Guide
Ask me questions while you tour the home.