57 Lynch St Lawrence, MA 01841
Tower Hill NeighborhoodEstimated Value: $746,000 - $890,000
6
Beds
3
Baths
4,029
Sq Ft
$207/Sq Ft
Est. Value
About This Home
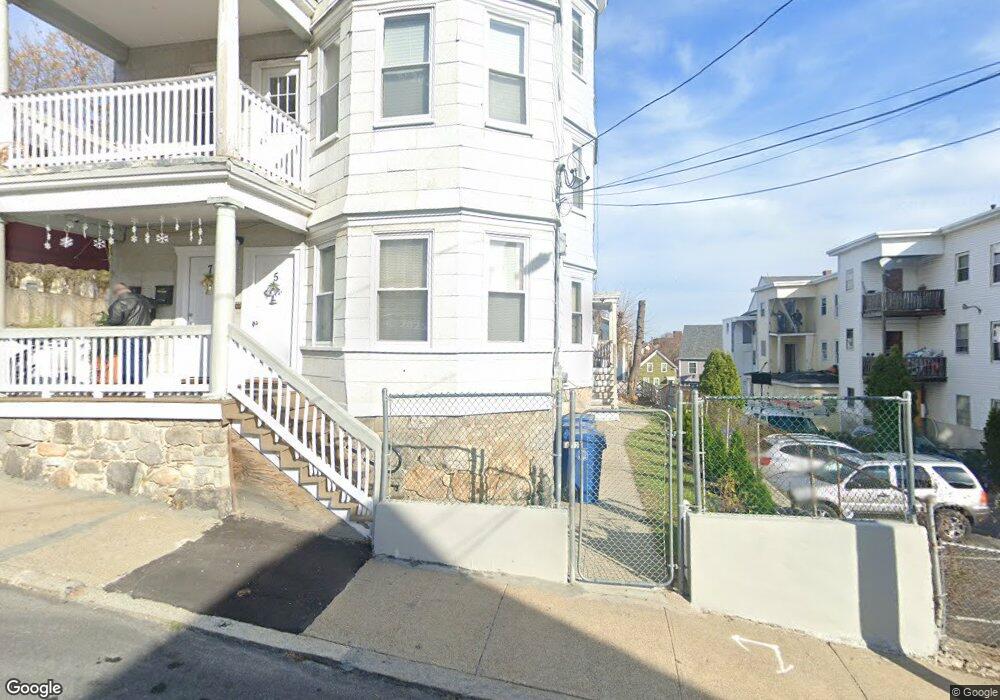
This home is located at 57 Lynch St, Lawrence, MA 01841 and is currently estimated at $833,667, approximately $206 per square foot. 57 Lynch St is a home located in Essex County with nearby schools including Cass Lake-Bena Elementary School, Olive Branch Elementary School, and James F. Hennessey School.
Ownership History
Date
Name
Owned For
Owner Type
Purchase Details
Closed on
Jan 27, 2000
Sold by
Castillo Julio and Castillo Milton
Bought by
Castillo Julio D and Castillo Geremias
Current Estimated Value
Home Financials for this Owner
Home Financials are based on the most recent Mortgage that was taken out on this home.
Original Mortgage
$65,000
Outstanding Balance
$20,637
Interest Rate
7.83%
Mortgage Type
Purchase Money Mortgage
Estimated Equity
$813,030
Purchase Details
Closed on
Jul 8, 1994
Sold by
Andover Bk
Bought by
Castillo Milton
Home Financials for this Owner
Home Financials are based on the most recent Mortgage that was taken out on this home.
Original Mortgage
$27,000
Interest Rate
8.51%
Mortgage Type
Purchase Money Mortgage
Purchase Details
Closed on
Feb 4, 1994
Sold by
Community Sb
Bought by
Community Sb
Create a Home Valuation Report for This Property
The Home Valuation Report is an in-depth analysis detailing your home's value as well as a comparison with similar homes in the area
Home Values in the Area
Average Home Value in this Area
Purchase History
| Date | Buyer | Sale Price | Title Company |
|---|---|---|---|
| Castillo Julio D | $40,000 | -- | |
| Castillo Julio D | $40,000 | -- | |
| Castillo Milton | $30,000 | -- | |
| Castillo Milton | $30,000 | -- | |
| Community Sb | $35,000 | -- | |
| Community Sb | $35,000 | -- |
Source: Public Records
Mortgage History
| Date | Status | Borrower | Loan Amount |
|---|---|---|---|
| Open | Castillo Julio D | $65,000 | |
| Closed | Community Sb | $65,000 | |
| Previous Owner | Community Sb | $27,000 |
Source: Public Records
Tax History Compared to Growth
Tax History
| Year | Tax Paid | Tax Assessment Tax Assessment Total Assessment is a certain percentage of the fair market value that is determined by local assessors to be the total taxable value of land and additions on the property. | Land | Improvement |
|---|---|---|---|---|
| 2025 | $5,653 | $642,400 | $102,400 | $540,000 |
| 2024 | $5,338 | $577,100 | $107,600 | $469,500 |
| 2023 | $5,477 | $539,100 | $103,900 | $435,200 |
| 2022 | $5,169 | $451,800 | $98,000 | $353,800 |
| 2021 | $4,919 | $400,900 | $98,000 | $302,900 |
| 2020 | $4,080 | $328,200 | $81,600 | $246,600 |
| 2019 | $3,874 | $283,200 | $60,700 | $222,500 |
| 2018 | $3,783 | $264,200 | $55,000 | $209,200 |
| 2017 | $3,544 | $231,000 | $52,100 | $178,900 |
| 2016 | $3,290 | $212,100 | $40,700 | $171,400 |
| 2015 | $3,156 | $208,700 | $40,700 | $168,000 |
Source: Public Records
Map
Nearby Homes
- 44-46 Butler St
- 62-66 Butler St
- 70 Butler St
- 499 Haverhill St
- 42 Morton St
- 50 Forest St
- 45 Bodwell St
- 202 Broadway Unit 2-3
- 202 Broadway Unit 3-3
- 30-32 Linden St
- 265 Ames St
- 1008 Essex St Unit 1010
- 82 Water St
- 139 West St
- 55-59 Water St
- 2 Washington St
- 12 Merrimack View Ct
- 95 Hancock St
- 179-181 West St
- 68 Middlebury St
- 21 Butler St Unit 23
- 68 Lynch St
- 17 Butler St Unit 19
- 4 Lynch St
- 13 Butler St Unit 15
- 23 Hampton St
- 25 Butler St Unit 27
- 25-27 Butler St
- 1 Lunch Spot
- 10 Lynch St
- 136 Margin St Unit 138
- 142-144 Margin St
- 33 1/2 Hampton St
- 9 Butler St Unit 11
- 142 Margin St Unit 144
- 29 Butler St Unit 31
- 29- 31 Butler St
- 22 Hampton St
- 15 Bevel St Unit 17
- 27 Bevel St Unit 29