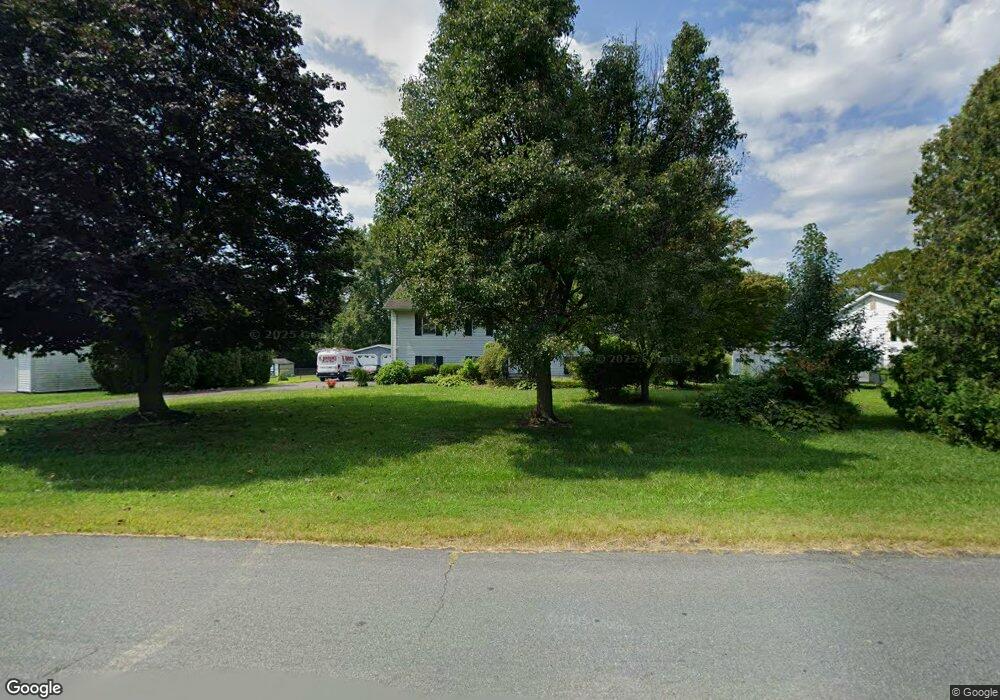
57 Macintosh Dr Colora, MD 21917
Estimated Value: $280,000 - $401,000
Studio
2
Baths
1,188
Sq Ft
$292/Sq Ft
Est. Value
About This Home
This home is located at 57 Macintosh Dr, Colora, MD 21917 and is currently estimated at $346,627, approximately $291 per square foot. 57 Macintosh Dr is a home located in Cecil County with nearby schools including Rising Sun Elementary School, Rising Sun Middle School, and Rising Sun High School.
Ownership History
Date
Name
Owned For
Owner Type
Purchase Details
Closed on
Dec 14, 2013
Sold by
Fleagle Christopher W and Fleagle Tammy E
Bought by
Fleagle Christopher W
Current Estimated Value
Home Financials for this Owner
Home Financials are based on the most recent Mortgage that was taken out on this home.
Original Mortgage
$203,245
Outstanding Balance
$149,851
Interest Rate
3.87%
Mortgage Type
FHA
Estimated Equity
$196,776
Purchase Details
Closed on
Mar 2, 2001
Sold by
Pierce David W and Pierce Elaine L
Bought by
Fleagle Christopher W and Fleagle Tammy E
Purchase Details
Closed on
May 31, 1988
Sold by
Schauer Robert J and Schauer Cynthia J
Bought by
Pierce David W and Pierce Elaine L
Home Financials for this Owner
Home Financials are based on the most recent Mortgage that was taken out on this home.
Original Mortgage
$79,794
Interest Rate
10.58%
Purchase Details
Closed on
Aug 28, 1986
Sold by
Bolen Stephen N and Bolen Kathleen C
Bought by
Schauer Robert J and Schauer Cynthia J
Home Financials for this Owner
Home Financials are based on the most recent Mortgage that was taken out on this home.
Original Mortgage
$80,650
Interest Rate
10.04%
Create a Home Valuation Report for This Property
The Home Valuation Report is an in-depth analysis detailing your home's value as well as a comparison with similar homes in the area
Home Values in the Area
Average Home Value in this Area
Purchase History
| Date | Buyer | Sale Price | Title Company |
|---|---|---|---|
| Fleagle Christopher W | -- | Title Resource Inc | |
| Fleagle Christopher W | $141,000 | -- | |
| Pierce David W | $89,000 | -- | |
| Schauer Robert J | $79,900 | -- |
Source: Public Records
Mortgage History
| Date | Status | Borrower | Loan Amount |
|---|---|---|---|
| Open | Fleagle Christopher W | $203,245 | |
| Previous Owner | Pierce David W | $79,794 | |
| Previous Owner | Schauer Robert J | $80,650 | |
| Closed | Fleagle Christopher W | -- |
Source: Public Records
Tax History
| Year | Tax Paid | Tax Assessment Tax Assessment Total Assessment is a certain percentage of the fair market value that is determined by local assessors to be the total taxable value of land and additions on the property. | Land | Improvement |
|---|---|---|---|---|
| 2025 | $2,783 | $251,000 | $68,600 | $182,400 |
| 2024 | $2,328 | $241,000 | $0 | $0 |
| 2023 | $1,900 | $231,000 | $0 | $0 |
| 2022 | $2,549 | $221,000 | $68,600 | $152,400 |
| 2021 | $2,498 | $217,667 | $0 | $0 |
| 2020 | $2,493 | $214,333 | $0 | $0 |
| 2019 | $2,405 | $211,000 | $68,600 | $142,400 |
| 2018 | $2,312 | $200,667 | $0 | $0 |
| 2017 | $2,223 | $190,333 | $0 | $0 |
| 2016 | $2,045 | $180,000 | $0 | $0 |
| 2015 | $2,045 | $180,000 | $0 | $0 |
| 2014 | $1,963 | $180,000 | $0 | $0 |
Source: Public Records
Map
Nearby Homes
- Lot 8 White Spruce Way
- 35 Coulson Dr
- 945 Firetower Rd
- 0 Colora Rd
- 1621 Liberty Grove Rd
- 404 Pearl St
- 43 Pearl St
- 66 Spready Oak Rd
- 27 Haines Ave
- 27 Behm Ln
- lot 2 White Spruce Way
- 10 Pogue Ave
- TBD Rowland Dr
- 149 Geralds Way
- 39 N Friendship Ct
- 1746 Hopewell Rd
- 10 N Hills Dr
- 62 Porters Bridge Rd
- 66 Ayers Dr
- Lots 126-127 Codjus Dr
- 45 Macintosh Dr
- 65 Macintosh Dr
- 37 Macintosh Dr
- 75 Macintosh Dr
- 62 Macintosh Dr
- 44 Macintosh Dr
- 85 Macintosh Dr
- 29 Macintosh Dr
- 76 Macintosh Dr
- 34 Macintosh Dr
- 97 Macintosh Dr
- 21 Macintosh Dr
- 10 Winesap Ct
- 23 Winesap Ct
- 28 Macintosh Dr
- 2421 Liberty Grove Rd
- 107 Macintosh Dr
- 88 Macintosh Dr
- 18 Winesap Ct
- 35 Winesap Ct
Your Personal Tour Guide
Ask me questions while you tour the home.