Estimated Value: $1,445,000 - $3,021,000
4
Beds
3
Baths
4,171
Sq Ft
$462/Sq Ft
Est. Value
About This Home
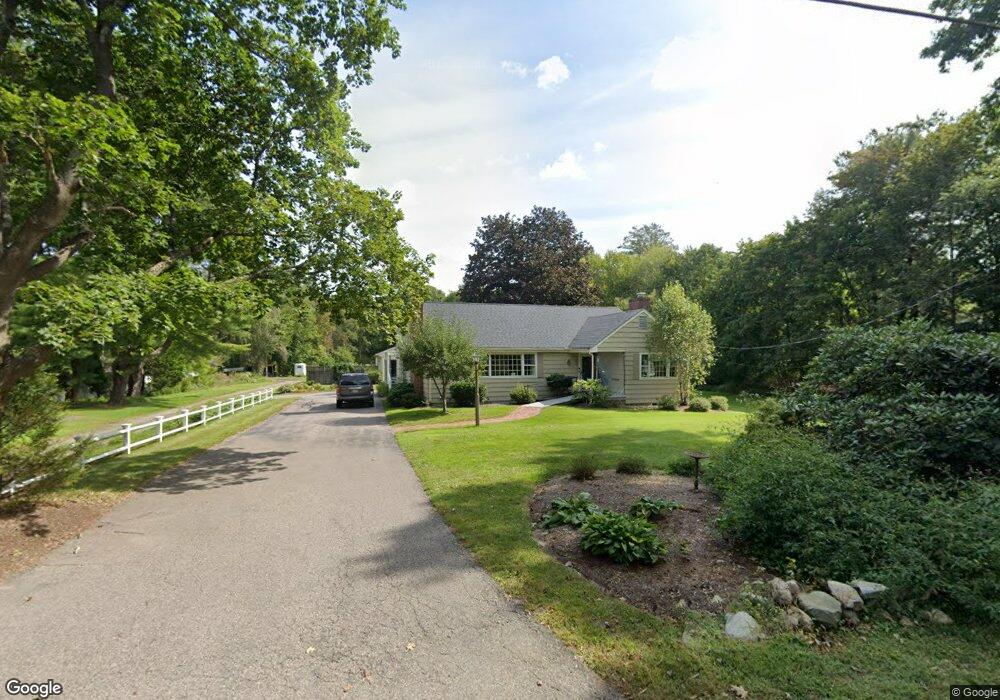
This home is located at 57 Main St, Dover, MA 02030 and is currently estimated at $1,925,502, approximately $461 per square foot. 57 Main St is a home located in Norfolk County with nearby schools including Chickering Elementary School, Dover-Sherborn Regional Middle School, and Dover-Sherborn Regional High School.
Ownership History
Date
Name
Owned For
Owner Type
Purchase Details
Closed on
Sep 28, 2025
Sold by
Keene Robert
Bought by
Robert Keene Ret 2025 and Keene
Current Estimated Value
Purchase Details
Closed on
Aug 12, 2025
Sold by
57 Main St Rt and Woodward
Bought by
Keene Robert
Purchase Details
Closed on
Aug 21, 2013
Sold by
Diane V Keene Ret and Keene
Bought by
57 Main Street Rt and Woodward
Create a Home Valuation Report for This Property
The Home Valuation Report is an in-depth analysis detailing your home's value as well as a comparison with similar homes in the area
Home Values in the Area
Average Home Value in this Area
Purchase History
| Date | Buyer | Sale Price | Title Company |
|---|---|---|---|
| Robert Keene Ret 2025 | -- | -- | |
| Keene Robert | -- | -- | |
| Keene Robert | -- | -- | |
| 57 Main Street Rt | -- | -- | |
| 57 Main Street Rt | -- | -- | |
| 57 Main Street Rt | -- | -- |
Source: Public Records
Mortgage History
| Date | Status | Borrower | Loan Amount |
|---|---|---|---|
| Previous Owner | 57 Main Street Rt | $180,500 |
Source: Public Records
Tax History
| Year | Tax Paid | Tax Assessment Tax Assessment Total Assessment is a certain percentage of the fair market value that is determined by local assessors to be the total taxable value of land and additions on the property. | Land | Improvement |
|---|---|---|---|---|
| 2025 | $11,933 | $1,058,800 | $664,400 | $394,400 |
| 2024 | $11,882 | $1,084,100 | $664,400 | $419,700 |
| 2023 | $10,461 | $858,200 | $522,800 | $335,400 |
| 2022 | $10,255 | $825,700 | $522,800 | $302,900 |
| 2021 | $10,643 | $825,700 | $522,800 | $302,900 |
| 2020 | $10,602 | $825,700 | $522,800 | $302,900 |
| 2019 | $10,923 | $844,800 | $522,800 | $322,000 |
| 2018 | $9,312 | $725,200 | $427,000 | $298,200 |
| 2017 | $9,293 | $712,100 | $413,900 | $298,200 |
| 2016 | $9,254 | $718,500 | $413,900 | $304,600 |
| 2015 | $9,125 | $718,500 | $413,900 | $304,600 |
Source: Public Records
Map
Nearby Homes
- 42 Troutbrook Rd
- 22 Main St
- 84 Pleasant St
- 62 Claybrook Rd
- 60 Claybrook Rd
- 8 Warren Rd
- 104 Glen St
- 9 Buttercup Ln
- 1 Old Colony Dr
- 68 Locust Ln
- 18 Phillips Pond Rd
- 2 Phillips Pond Rd
- 182 Winding River Rd
- 29 Water St
- 12 Winding River Cir
- 4 Claybrook Rd
- 389 Grove St
- 83 Eliot St
- 121 Livingston Rd
- 104 Eliot St
Your Personal Tour Guide
Ask me questions while you tour the home.