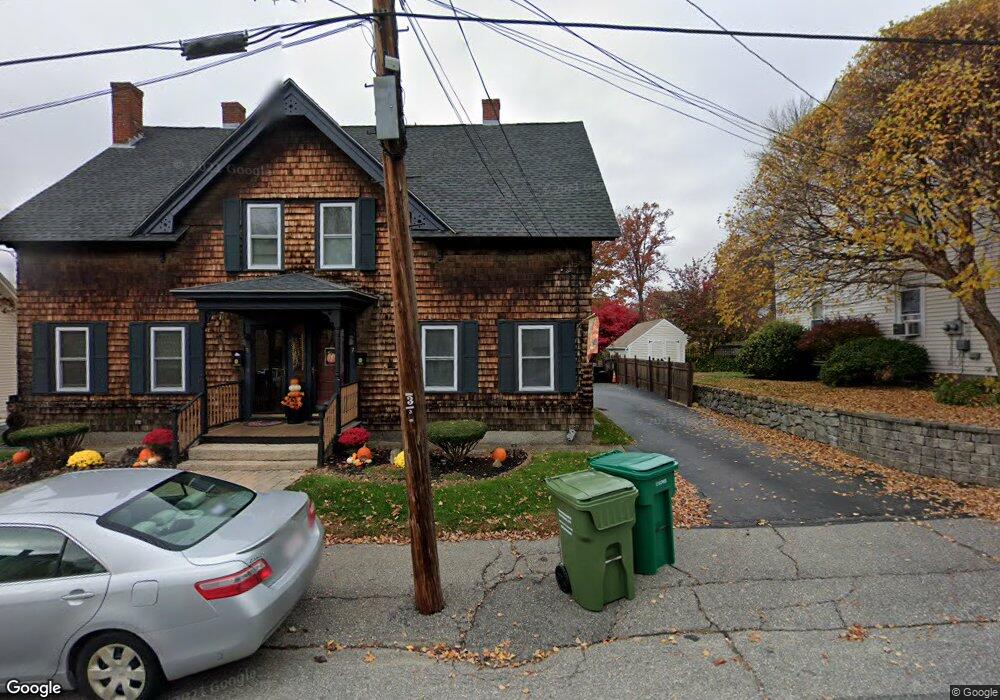
57 Maple St Whitinsville, MA 01588
Estimated Value: $479,641 - $558,000
6
Beds
2
Baths
2,520
Sq Ft
$208/Sq Ft
Est. Value
About This Home
This home is located at 57 Maple St, Whitinsville, MA 01588 and is currently estimated at $524,160, approximately $208 per square foot. 57 Maple St is a home located in Worcester County with nearby schools including Northbridge Elementary School, Northbridge Middle School, and Northbridge High School.
Ownership History
Date
Name
Owned For
Owner Type
Purchase Details
Closed on
May 17, 1993
Sold by
Valk Elizabeth and Valk Edward
Bought by
Frieswyk Marc and Vaudreuil Yvette
Current Estimated Value
Home Financials for this Owner
Home Financials are based on the most recent Mortgage that was taken out on this home.
Original Mortgage
$121,334
Interest Rate
7.47%
Mortgage Type
Purchase Money Mortgage
Create a Home Valuation Report for This Property
The Home Valuation Report is an in-depth analysis detailing your home's value as well as a comparison with similar homes in the area
Home Values in the Area
Average Home Value in this Area
Purchase History
| Date | Buyer | Sale Price | Title Company |
|---|---|---|---|
| Frieswyk Marc | $124,000 | -- | |
| Frieswyk Marc | $124,000 | -- |
Source: Public Records
Mortgage History
| Date | Status | Borrower | Loan Amount |
|---|---|---|---|
| Open | Frieswyk Marc | $114,000 | |
| Closed | Frieswyk Marc | $121,334 |
Source: Public Records
Tax History Compared to Growth
Tax History
| Year | Tax Paid | Tax Assessment Tax Assessment Total Assessment is a certain percentage of the fair market value that is determined by local assessors to be the total taxable value of land and additions on the property. | Land | Improvement |
|---|---|---|---|---|
| 2025 | $4,649 | $394,300 | $127,400 | $266,900 |
| 2024 | $4,218 | $348,900 | $127,400 | $221,500 |
| 2023 | $4,084 | $315,100 | $120,700 | $194,400 |
| 2022 | $3,796 | $275,700 | $92,900 | $182,800 |
| 2021 | $3,470 | $239,500 | $88,500 | $151,000 |
| 2020 | $3,132 | $226,300 | $88,500 | $137,800 |
| 2019 | $2,678 | $206,500 | $88,500 | $118,000 |
| 2018 | $2,618 | $202,300 | $84,300 | $118,000 |
| 2017 | $2,648 | $195,700 | $84,300 | $111,400 |
| 2016 | $2,471 | $179,700 | $72,400 | $107,300 |
| 2015 | $2,404 | $179,700 | $72,400 | $107,300 |
| 2014 | $2,298 | $173,300 | $72,400 | $100,900 |
Source: Public Records
Map
Nearby Homes
- 24 Crescent St Unit 6
- 11 A St Unit 11
- 14 C St Unit 24
- 14 C St Unit 14
- 17 Overlook St
- 2 D St
- 9 Banning Dr
- Lots 1-9 Spring St
- 111 Windsor Ridge Dr
- 128 Linwood Ave
- 18 East St Unit 24
- 46 Rebecca Rd
- 192 Rebecca Rd
- 3 Bayliss Way
- 22 Bayliss Way
- 708 Marston Rd
- 26 Bayliss Way
- 201 Prescott Rd
- 21 Granite St
- 121 East St Unit 121
- 9 Maple St Unit 11
- 11 Maple St
- 9 Maple St Unit 9
- 19 Maple Ct Unit 1
- 13 Maple St
- 13 Maple St Unit 15
- 13 Maple St
- 8 Maple St
- 6 Maple St
- 8 Maple St Unit B
- 6 Maple St Unit A
- 6 Maple St
- 12 Maple St Unit 12
- 10 Maple St Unit 12
- 17 Maple St Unit 19
- 252 Main St Unit 254
- 2 Maple St
- 4 Maple St
- 2 Maple St Unit 2
- 19 Maple St