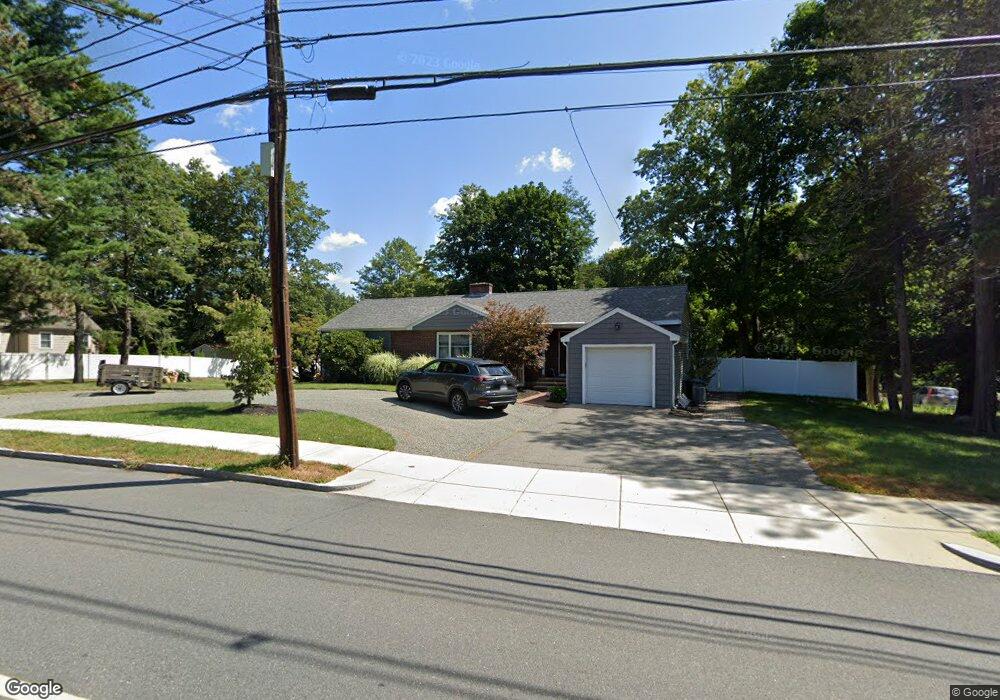
57 Oak St Stoneham, MA 02180
Lindenwood NeighborhoodEstimated Value: $759,000 - $843,901
3
Beds
3
Baths
1,973
Sq Ft
$409/Sq Ft
Est. Value
About This Home
This home is located at 57 Oak St, Stoneham, MA 02180 and is currently estimated at $807,225, approximately $409 per square foot. 57 Oak St is a home located in Middlesex County with nearby schools including Stoneham High School, St. Patrick Elementary School, and St Joseph School.
Ownership History
Date
Name
Owned For
Owner Type
Purchase Details
Closed on
Mar 9, 2011
Sold by
Tuminelli Ft and Moore Karen J
Bought by
Dipersio Nicholas J
Current Estimated Value
Home Financials for this Owner
Home Financials are based on the most recent Mortgage that was taken out on this home.
Original Mortgage
$296,100
Outstanding Balance
$203,833
Interest Rate
4.83%
Mortgage Type
Purchase Money Mortgage
Estimated Equity
$603,392
Purchase Details
Closed on
Nov 23, 2010
Sold by
Tuminelli Frank P
Bought by
Tuminelli Ft and Moore Karen J
Purchase Details
Closed on
Apr 16, 2009
Sold by
Tuminelli Frank P and Tuminelli Genevieve N
Bought by
Tuminelli Frank P
Create a Home Valuation Report for This Property
The Home Valuation Report is an in-depth analysis detailing your home's value as well as a comparison with similar homes in the area
Home Values in the Area
Average Home Value in this Area
Purchase History
| Date | Buyer | Sale Price | Title Company |
|---|---|---|---|
| Dipersio Nicholas J | $329,000 | -- | |
| Tuminelli Ft | -- | -- | |
| Tuminelli Frank P | -- | -- |
Source: Public Records
Mortgage History
| Date | Status | Borrower | Loan Amount |
|---|---|---|---|
| Open | Dipersio Nicholas J | $296,100 |
Source: Public Records
Tax History
| Year | Tax Paid | Tax Assessment Tax Assessment Total Assessment is a certain percentage of the fair market value that is determined by local assessors to be the total taxable value of land and additions on the property. | Land | Improvement |
|---|---|---|---|---|
| 2025 | $7,332 | $716,700 | $382,800 | $333,900 |
| 2024 | $7,067 | $667,300 | $352,800 | $314,500 |
| 2023 | $6,936 | $624,900 | $322,800 | $302,100 |
| 2022 | $6,140 | $589,800 | $302,800 | $287,000 |
| 2021 | $6,028 | $557,100 | $282,800 | $274,300 |
| 2020 | $10,186 | $559,100 | $282,800 | $276,300 |
| 2019 | $5,972 | $532,300 | $262,800 | $269,500 |
| 2018 | $6,583 | $480,900 | $232,800 | $248,100 |
| 2017 | $5,432 | $456,300 | $232,800 | $223,500 |
| 2016 | $5,335 | $420,100 | $217,800 | $202,300 |
| 2015 | $5,227 | $403,300 | $217,800 | $185,500 |
| 2014 | $4,626 | $342,900 | $172,800 | $170,100 |
Source: Public Records
Map
Nearby Homes
- 23 Sunrise Ave
- 10 Rodgers Rd
- 159 Main St Unit 27C
- 159 Main St Unit 39A
- 1 Alden Ave
- 98 Main St Unit 2
- 8 Steele St
- 68 Main St Unit 21C
- 66 Main St Unit 15A
- 12 Isola Ln
- 64 Main St Unit 24B
- 1 Tremont St
- 62 High St Unit Lot 8
- 62 High St Unit 4
- 62 High St Unit Lot 5
- 62 High St Unit Lot 7
- 62 High St Unit Lot 12
- 62 High St Unit 3
- 21 Tremont St Unit B
- 21 Tremont St Unit A
Your Personal Tour Guide
Ask me questions while you tour the home.