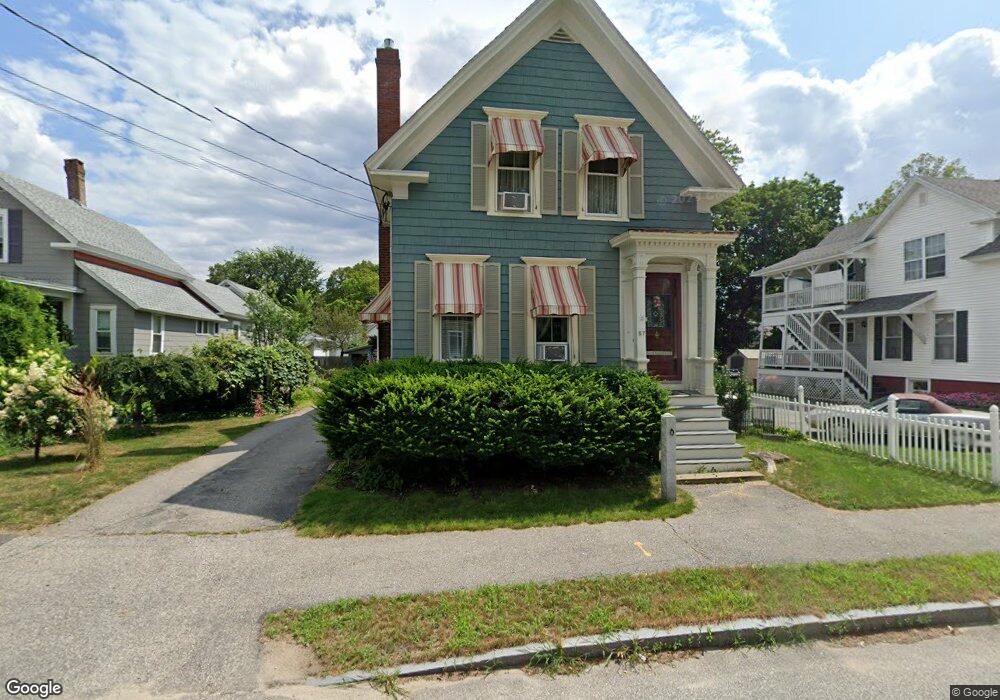
57 Perley St Concord, NH 03301
South End NeighborhoodEstimated Value: $441,000 - $492,000
4
Beds
2
Baths
1,930
Sq Ft
$242/Sq Ft
Est. Value
About This Home
This home is located at 57 Perley St, Concord, NH 03301 and is currently estimated at $466,548, approximately $241 per square foot. 57 Perley St is a home located in Merrimack County with nearby schools including Christa McAuliffe School, Rundlett Middle School, and Concord High School.
Ownership History
Date
Name
Owned For
Owner Type
Purchase Details
Closed on
Jan 3, 2019
Sold by
Weston Nancy A
Bought by
Nancy A Weston 2019 Ret
Current Estimated Value
Purchase Details
Closed on
Aug 1, 1996
Sold by
Bryant Gregory K and Bryant Maria K
Bought by
Weston Richard K
Home Financials for this Owner
Home Financials are based on the most recent Mortgage that was taken out on this home.
Original Mortgage
$107,100
Interest Rate
8.27%
Mortgage Type
Purchase Money Mortgage
Create a Home Valuation Report for This Property
The Home Valuation Report is an in-depth analysis detailing your home's value as well as a comparison with similar homes in the area
Home Values in the Area
Average Home Value in this Area
Purchase History
| Date | Buyer | Sale Price | Title Company |
|---|---|---|---|
| Nancy A Weston 2019 Ret | -- | -- | |
| Weston Richard K | $105,000 | -- |
Source: Public Records
Mortgage History
| Date | Status | Borrower | Loan Amount |
|---|---|---|---|
| Previous Owner | Weston Richard K | $57,000 | |
| Previous Owner | Weston Richard K | $107,100 |
Source: Public Records
Tax History
| Year | Tax Paid | Tax Assessment Tax Assessment Total Assessment is a certain percentage of the fair market value that is determined by local assessors to be the total taxable value of land and additions on the property. | Land | Improvement |
|---|---|---|---|---|
| 2024 | $8,423 | $304,200 | $90,000 | $214,200 |
| 2023 | $8,171 | $304,200 | $90,000 | $214,200 |
| 2022 | $7,876 | $304,200 | $90,000 | $214,200 |
| 2021 | $7,591 | $302,200 | $90,000 | $212,200 |
| 2020 | $7,043 | $263,200 | $71,900 | $191,300 |
| 2019 | $6,764 | $243,500 | $66,700 | $176,800 |
| 2018 | $6,427 | $228,000 | $66,700 | $161,300 |
| 2017 | $6,086 | $215,500 | $66,700 | $148,800 |
| 2016 | $5,800 | $209,600 | $66,700 | $142,900 |
| 2015 | $5,463 | $199,800 | $65,300 | $134,500 |
| 2014 | $5,191 | $199,800 | $65,300 | $134,500 |
| 2013 | -- | $198,400 | $65,300 | $133,100 |
| 2012 | -- | $197,400 | $65,300 | $132,100 |
Source: Public Records
Map
Nearby Homes
- 47 South St
- 0 Spruce St Unit 88
- 20 Carter St
- 105 S Main St
- 4 N Spring St
- 1 Matthew St Unit 6
- 0 South St Unit 4969509
- 5 Broad Ave
- 1 Kensington Rd
- 11 Washington St
- 55 Tremont St
- 24 Hazel Dr
- 22 Longmeadow Dr
- 7 Highridge Trail
- 22 Fairfield Dr
- 157 Rumford St
- 28 Stevens Dr
- 15 Bridle Path Trail
- 30 Penacook St
- 6 Grover St
- 59 Perley St
- 55 Perley St
- 69-71 Perley St
- 50 Downing St
- 61 Perley St Unit 63
- 30 Pierce St
- 54 Perley St
- 28 Pierce St
- 52 Perley St
- 26 Pierce St
- 65 Perley St Unit 67
- 52 Downing St
- 56 Downing St
- 54 Downing St
- 46 Downing St Unit 48
- 58-60 Downing St
- 27 Pierce St
- 69 Perley St Unit 71
- 29 Pierce St
- 22 Pierce St