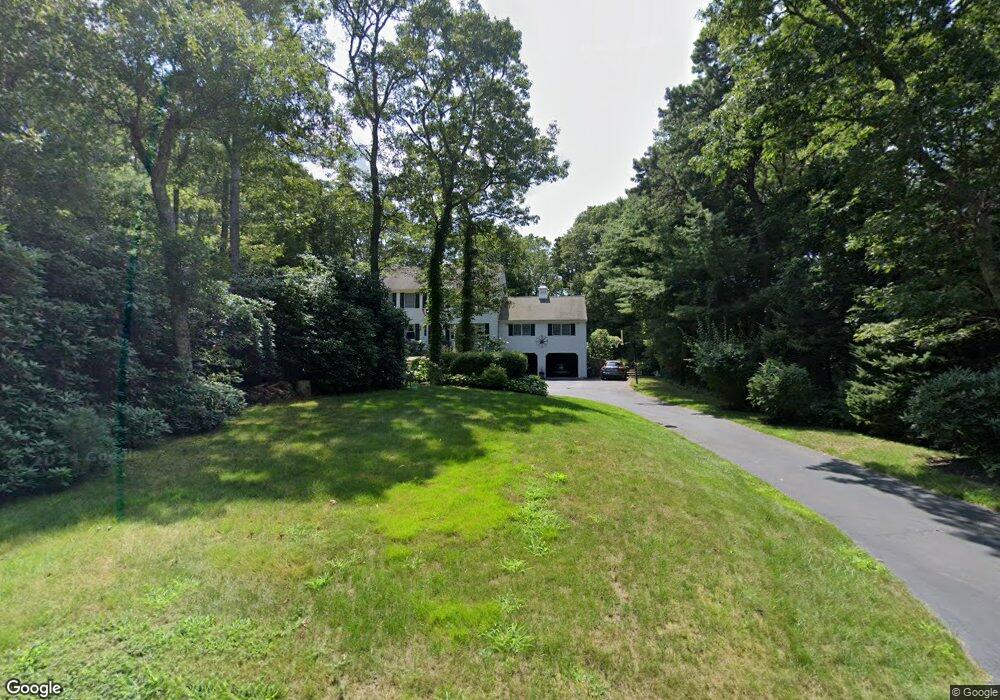
57 Popple Bottom Rd Sandwich, MA 02563
Estimated Value: $780,000 - $1,078,000
4
Beds
3
Baths
2,701
Sq Ft
$345/Sq Ft
Est. Value
About This Home
This home is located at 57 Popple Bottom Rd, Sandwich, MA 02563 and is currently estimated at $933,134, approximately $345 per square foot. 57 Popple Bottom Rd is a home located in Barnstable County with nearby schools including Sandwich Middle High School and Riverview School.
Ownership History
Date
Name
Owned For
Owner Type
Purchase Details
Closed on
May 16, 2014
Sold by
Casey-Lane Thomas M and Casey-Lane C
Bought by
Casey-Lane Catherine and Lane Thomas M
Current Estimated Value
Purchase Details
Closed on
Jan 22, 2013
Sold by
T M & C Casey Lane Ft
Bought by
Casey-Lane Catherine and Lane Thomas M
Home Financials for this Owner
Home Financials are based on the most recent Mortgage that was taken out on this home.
Original Mortgage
$346,000
Interest Rate
3.39%
Mortgage Type
New Conventional
Purchase Details
Closed on
Feb 17, 2012
Sold by
Lane Thomas M and Casey Lane C
Bought by
Thomas M Lane Ft
Purchase Details
Closed on
May 10, 2002
Sold by
Caldwell Don R and Caldwell Darlene
Bought by
Lane Thomas M and Casey-Lane Catherine
Home Financials for this Owner
Home Financials are based on the most recent Mortgage that was taken out on this home.
Original Mortgage
$260,000
Interest Rate
7.18%
Mortgage Type
Purchase Money Mortgage
Purchase Details
Closed on
Oct 19, 1998
Sold by
Shea Jean M and Shea Kevin F
Bought by
Caldwell Don R and Caldwell Darlene
Home Financials for this Owner
Home Financials are based on the most recent Mortgage that was taken out on this home.
Original Mortgage
$10,000
Interest Rate
6.8%
Mortgage Type
Purchase Money Mortgage
Create a Home Valuation Report for This Property
The Home Valuation Report is an in-depth analysis detailing your home's value as well as a comparison with similar homes in the area
Home Values in the Area
Average Home Value in this Area
Purchase History
| Date | Buyer | Sale Price | Title Company |
|---|---|---|---|
| Casey-Lane Catherine | -- | -- | |
| Casey-Lane Catherine | -- | -- | |
| Thomas M Lane Ft | -- | -- | |
| Lane Thomas M | $462,500 | -- | |
| Caldwell Don R | $268,000 | -- |
Source: Public Records
Mortgage History
| Date | Status | Borrower | Loan Amount |
|---|---|---|---|
| Previous Owner | Casey-Lane Catherine | $346,000 | |
| Previous Owner | Lane Thomas M | $260,000 | |
| Previous Owner | Caldwell Don R | $10,000 |
Source: Public Records
Tax History Compared to Growth
Tax History
| Year | Tax Paid | Tax Assessment Tax Assessment Total Assessment is a certain percentage of the fair market value that is determined by local assessors to be the total taxable value of land and additions on the property. | Land | Improvement |
|---|---|---|---|---|
| 2025 | $7,617 | $720,600 | $132,000 | $588,600 |
| 2024 | $7,757 | $718,200 | $133,600 | $584,600 |
| 2023 | $7,590 | $660,000 | $121,400 | $538,600 |
| 2022 | $7,263 | $551,900 | $117,300 | $434,600 |
| 2021 | $6,874 | $499,200 | $112,800 | $386,400 |
| 2020 | $6,832 | $477,400 | $110,800 | $366,600 |
| 2019 | $6,599 | $460,800 | $117,600 | $343,200 |
| 2018 | $6,186 | $432,900 | $113,500 | $319,400 |
| 2017 | $6,090 | $407,900 | $109,900 | $298,000 |
| 2016 | $5,830 | $402,900 | $108,800 | $294,100 |
| 2015 | $5,943 | $401,000 | $112,700 | $288,300 |
Source: Public Records
Map
Nearby Homes
- 55 Popple Bottom Rd
- 1 Bowmans Way
- 53 Popple Bottom Rd
- 3 Bowmans Way
- 12 Rolling Ridge Ln
- 51 Popple Bottom Rd
- 14 Rolling Ridge Ln
- 10 Rolling Ridge Ln
- 5 Bowmans Way
- 68 Popple Bottom Rd
- 62 Popple Bottom Rd
- 49 Popple Bottom Rd
- 8 Rolling Ridge Ln
- 67 Popple Bottom Rd
- 11 Rolling Ridge Ln
- 47 Popple Bottom Rd
- 9 Rolling Ridge Ln
- 6 Rolling Ridge Ln
- 4 Bowmans Way
- 0 Rolling Ridge Ln