57 Ray Rd Wrentham, MA 02093
West Wrentham NeighborhoodEstimated Value: $1,080,083 - $1,331,000
5
Beds
4
Baths
3,401
Sq Ft
$345/Sq Ft
Est. Value
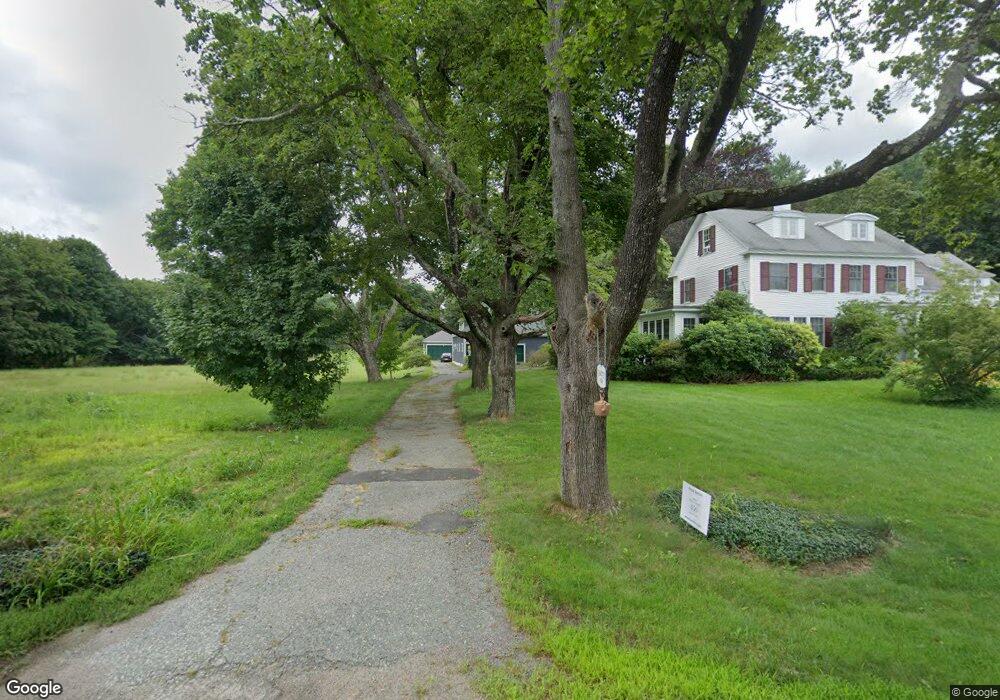
About This Home
This home is located at 57 Ray Rd, Wrentham, MA 02093 and is currently estimated at $1,173,271, approximately $344 per square foot. 57 Ray Rd is a home located in Norfolk County with nearby schools including Delaney Elementary School, Charles E Roderick, and Benjamin Franklin Classical Charter Public School.
Ownership History
Date
Name
Owned For
Owner Type
Purchase Details
Closed on
Nov 7, 2007
Sold by
Bove Suzanne S and Michael Bove V
Bought by
Bove Suzanne S and Michael Bove V
Current Estimated Value
Create a Home Valuation Report for This Property
The Home Valuation Report is an in-depth analysis detailing your home's value as well as a comparison with similar homes in the area
Home Values in the Area
Average Home Value in this Area
Purchase History
| Date | Buyer | Sale Price | Title Company |
|---|---|---|---|
| Bove Suzanne S | -- | -- |
Source: Public Records
Tax History
| Year | Tax Paid | Tax Assessment Tax Assessment Total Assessment is a certain percentage of the fair market value that is determined by local assessors to be the total taxable value of land and additions on the property. | Land | Improvement |
|---|---|---|---|---|
| 2025 | $11,264 | $971,900 | $344,500 | $627,400 |
| 2024 | $10,836 | $903,000 | $344,500 | $558,500 |
| 2023 | $10,748 | $851,700 | $314,500 | $537,200 |
| 2022 | $10,381 | $759,400 | $294,600 | $464,800 |
| 2021 | $9,745 | $692,600 | $258,800 | $433,800 |
| 2020 | $10,867 | $762,600 | $338,300 | $424,300 |
| 2019 | $10,534 | $746,000 | $338,300 | $407,700 |
| 2018 | $10,670 | $749,300 | $337,900 | $411,400 |
| 2017 | $10,414 | $730,800 | $331,300 | $399,500 |
| 2016 | $10,189 | $713,500 | $321,800 | $391,700 |
| 2015 | $10,120 | $675,600 | $309,400 | $366,200 |
| 2014 | $9,988 | $652,400 | $297,600 | $354,800 |
Source: Public Records
Map
Nearby Homes
- 1620 West St
- 1565 West St
- 10 Follett Dr
- 60 Grant Ave
- 9 Reagan Ave
- 2095 West St
- 172 Pine Swamp Rd
- 180 Pine Swamp Rd
- 56 Pine Swamp Rd
- 47 Austin Dr
- 365 W Wrentham Rd
- 25 Nature View Dr
- 11 Amber Dr
- 20 Nature View Dr
- 20 Field Cir
- 955 Summer St
- 925 Washington St
- 613 West St
- 51 Reservoir Rd
- 9 Pebble Cir Unit 9
Your Personal Tour Guide
Ask me questions while you tour the home.