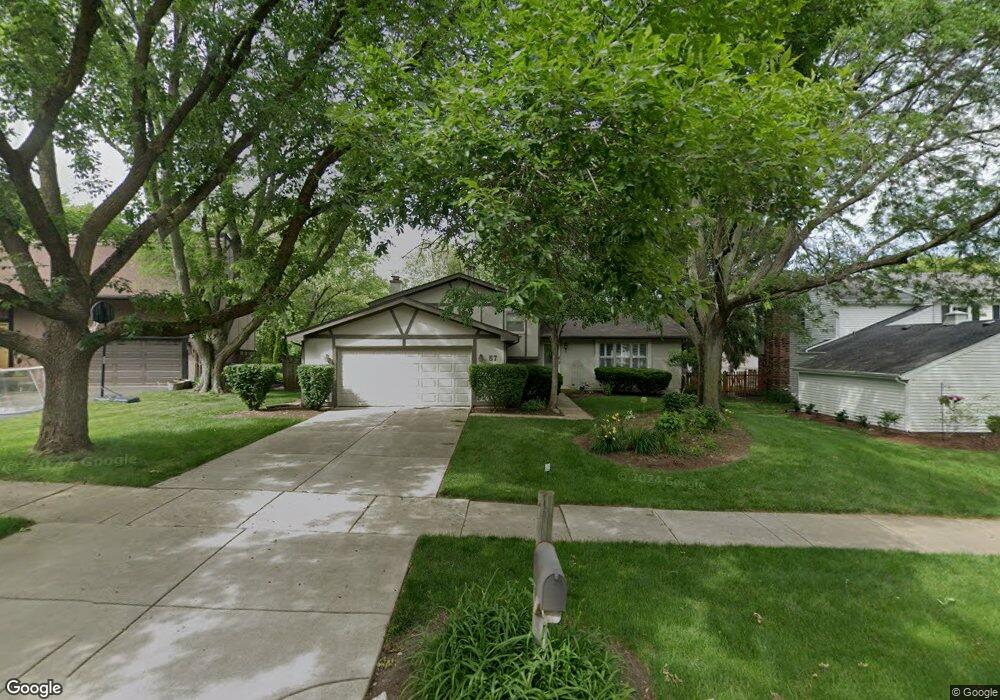
57 Redstart Rd Naperville, IL 60565
Maple Brook NeighborhoodEstimated Value: $446,353 - $545,000
Studio
1
Bath
1,304
Sq Ft
$389/Sq Ft
Est. Value
About This Home
This home is located at 57 Redstart Rd, Naperville, IL 60565 and is currently estimated at $507,338, approximately $389 per square foot. 57 Redstart Rd is a home located in DuPage County with nearby schools including Maplebrook Elementary School, Lincoln Jr. High School, and Naperville Central High School.
Ownership History
Date
Name
Owned For
Owner Type
Purchase Details
Closed on
Dec 23, 2004
Sold by
Jenkins Christopher J
Bought by
Simmons Alisa C
Current Estimated Value
Purchase Details
Closed on
Feb 26, 2003
Sold by
Leon Edgar A and Bradley Sarah E
Bought by
Jenkins Christopher and Simmons Alisa
Home Financials for this Owner
Home Financials are based on the most recent Mortgage that was taken out on this home.
Original Mortgage
$275,000
Interest Rate
6%
Purchase Details
Closed on
Jul 6, 1998
Sold by
Connors Craig M and Connors Elizabeth W
Bought by
Leon Edgar A and Bradley Sarah E
Home Financials for this Owner
Home Financials are based on the most recent Mortgage that was taken out on this home.
Original Mortgage
$162,000
Interest Rate
7.07%
Purchase Details
Closed on
Feb 19, 1998
Sold by
Connors Elizabeth Woerner
Bought by
Connors Craig M and Connors Elizabeth W
Purchase Details
Closed on
Oct 4, 1993
Sold by
Woerner Ralph Daniel
Bought by
Woerner Elizabeth Rosemary
Create a Home Valuation Report for This Property
The Home Valuation Report is an in-depth analysis detailing your home's value as well as a comparison with similar homes in the area
Home Values in the Area
Average Home Value in this Area
Purchase History
| Date | Buyer | Sale Price | Title Company |
|---|---|---|---|
| Simmons Alisa C | -- | -- | |
| Jenkins Christopher | $265,000 | First American Title | |
| Leon Edgar A | $180,000 | -- | |
| Connors Craig M | -- | -- | |
| Woerner Elizabeth Rosemary | -- | -- |
Source: Public Records
Mortgage History
| Date | Status | Borrower | Loan Amount |
|---|---|---|---|
| Previous Owner | Jenkins Christopher | $275,000 | |
| Previous Owner | Leon Edgar A | $162,000 |
Source: Public Records
Tax History
| Year | Tax Paid | Tax Assessment Tax Assessment Total Assessment is a certain percentage of the fair market value that is determined by local assessors to be the total taxable value of land and additions on the property. | Land | Improvement |
|---|---|---|---|---|
| 2024 | $8,098 | $140,184 | $74,343 | $65,841 |
| 2023 | $7,794 | $127,940 | $67,850 | $60,090 |
| 2022 | $7,498 | $121,850 | $64,620 | $57,230 |
| 2021 | $7,221 | $117,250 | $62,180 | $55,070 |
| 2020 | $7,066 | $115,140 | $61,060 | $54,080 |
| 2019 | $6,856 | $110,160 | $58,420 | $51,740 |
| 2018 | $6,681 | $107,470 | $56,990 | $50,480 |
| 2017 | $6,543 | $103,850 | $55,070 | $48,780 |
| 2016 | $6,409 | $100,100 | $53,080 | $47,020 |
| 2015 | $6,363 | $94,270 | $49,990 | $44,280 |
| 2014 | $6,236 | $89,780 | $47,610 | $42,170 |
| 2013 | $6,142 | $89,990 | $47,720 | $42,270 |
Source: Public Records
Map
Nearby Homes
- 48 Starling Ln
- 1751 S Washington St Unit 1
- 1754 S Washington St Unit 1754
- 381 Prairie Knoll Dr
- 124 E Bailey Rd Unit E
- 138 E Bailey Rd Unit M
- 144 E Bailey Rd Unit D
- 264 E Bailey Rd Unit C
- 228 E Bailey Rd Unit F
- 1712 Coach Dr
- 2057 Lancaster Cir Unit 101C
- 321 Carriage Hill Rd
- 307 Leeds Ct
- 47 Glencoe Ct Unit 102D
- 1715 Amelia Ct
- 621 Bourbon Ct
- 517 Sheffield Rd
- 510 Harlowe Ln Unit 2001C
- 1546 Treeline Ct Unit 405
- 627 Bourbon Ct
Your Personal Tour Guide
Ask me questions while you tour the home.