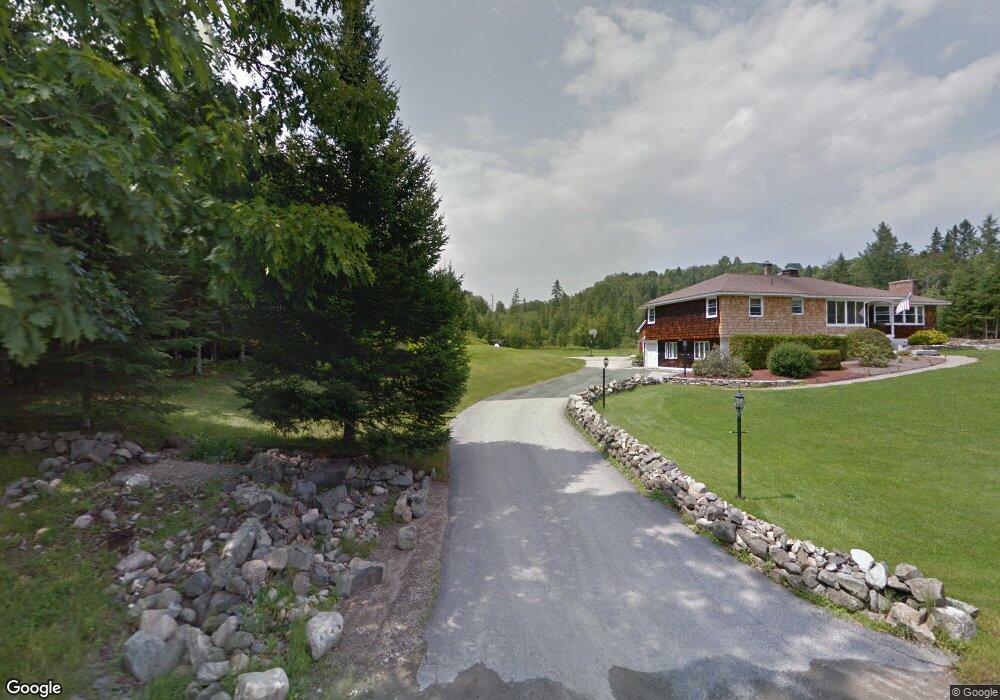
57 Reed Rd Lancaster, NH 03584
Estimated Value: $344,000 - $564,000
4
Beds
2
Baths
2,481
Sq Ft
$186/Sq Ft
Est. Value
About This Home
This home is located at 57 Reed Rd, Lancaster, NH 03584 and is currently estimated at $461,546, approximately $186 per square foot. 57 Reed Rd is a home located in Coos County with nearby schools including Lancaster Elementary School, White Mountains Regional High School, and Sunny Brook Montessori School.
Ownership History
Date
Name
Owned For
Owner Type
Purchase Details
Closed on
Jul 8, 2020
Sold by
Rexford Randall B and Rexford Patricia L
Bought by
R B & P L Rexford Irt
Current Estimated Value
Purchase Details
Closed on
Apr 24, 2008
Sold by
Wallace Stephen L
Bought by
Rexford Randall and Rexford Patricia
Home Financials for this Owner
Home Financials are based on the most recent Mortgage that was taken out on this home.
Original Mortgage
$130,000
Interest Rate
6.22%
Mortgage Type
Unknown
Create a Home Valuation Report for This Property
The Home Valuation Report is an in-depth analysis detailing your home's value as well as a comparison with similar homes in the area
Home Values in the Area
Average Home Value in this Area
Purchase History
| Date | Buyer | Sale Price | Title Company |
|---|---|---|---|
| R B & P L Rexford Irt | -- | None Available | |
| R B & P L Rexford Irt | -- | None Available | |
| Rexford Randall | $65,100 | -- |
Source: Public Records
Mortgage History
| Date | Status | Borrower | Loan Amount |
|---|---|---|---|
| Previous Owner | Rexford Randall | $130,000 |
Source: Public Records
Tax History Compared to Growth
Tax History
| Year | Tax Paid | Tax Assessment Tax Assessment Total Assessment is a certain percentage of the fair market value that is determined by local assessors to be the total taxable value of land and additions on the property. | Land | Improvement |
|---|---|---|---|---|
| 2024 | $7,865 | $410,054 | $95,354 | $314,700 |
| 2023 | $7,098 | $410,054 | $95,354 | $314,700 |
| 2022 | $6,394 | $263,239 | $62,039 | $201,200 |
| 2021 | $6,894 | $263,234 | $62,034 | $201,200 |
| 2020 | $6,512 | $263,234 | $62,034 | $201,200 |
| 2019 | $6,555 | $263,237 | $62,037 | $201,200 |
| 2018 | $6,723 | $263,221 | $62,021 | $201,200 |
| 2017 | $6,213 | $251,808 | $62,008 | $189,800 |
| 2016 | $6,449 | $251,811 | $62,011 | $189,800 |
| 2015 | $6,921 | $251,752 | $61,952 | $189,800 |
| 2014 | $5,891 | $251,736 | $75,800 | $175,936 |
| 2013 | $5,878 | $251,751 | $75,800 | $175,951 |
Source: Public Records
Map
Nearby Homes
- 218 Portland St
- Lot 82 Portland St
- Lot 2 Portland St
- Lot 26 Hartco Ave
- Lot 21 Hartco Ave
- Lot 11 Hartco Ave
- Lot 14 Hartco Ave
- Lot 9 Hartco Ave
- Lot 24 Hartco Ave
- Lot 23 Hartco Ave
- Lot 17 Hartco Ave
- Lot 20 Hartco Ave
- Lot 13 Hartco Ave
- Lot 15 Hartco Ave
- Lot 19 Hartco Ave
- Lot 33-34 Hartco Ave
- Lot 13A Hartco Ave
- Lot 18 Hartco Ave
- Lot 25 Hartco Ave
- Lot 22 Hartco Ave