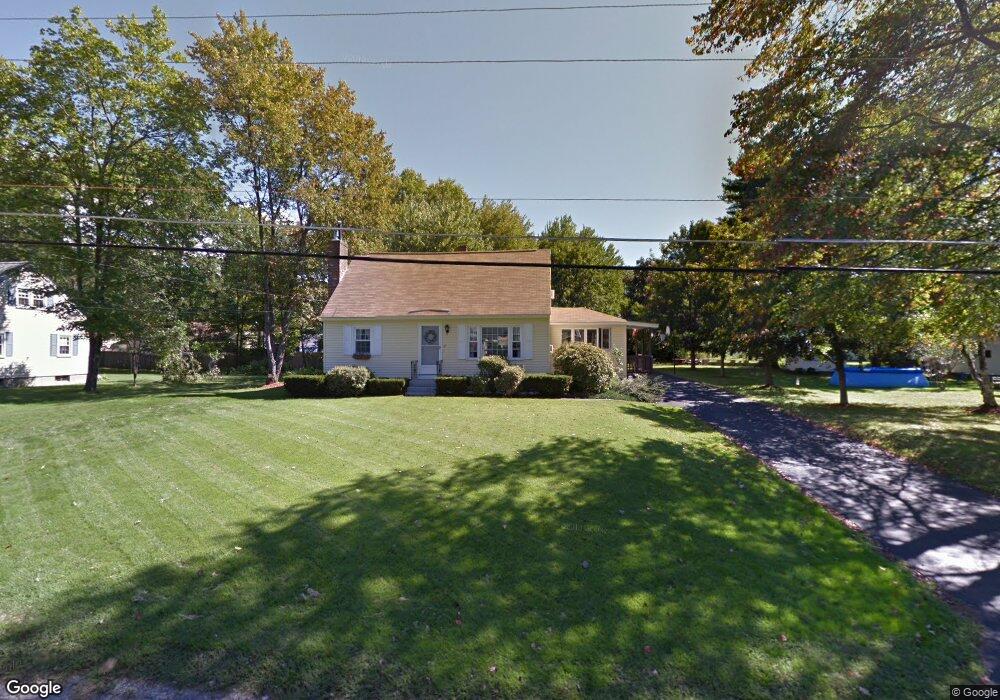
57 River Rd Allenstown, NH 03275
Estimated Value: $403,000 - $454,150
3
Beds
2
Baths
1,848
Sq Ft
$233/Sq Ft
Est. Value
About This Home
This home is located at 57 River Rd, Allenstown, NH 03275 and is currently estimated at $430,288, approximately $232 per square foot. 57 River Rd is a home located in Merrimack County with nearby schools including Allenstown Elementary School, Armand R. Dupont School, and Tender Years Child Care & Learning Center.
Ownership History
Date
Name
Owned For
Owner Type
Purchase Details
Closed on
Sep 24, 2010
Sold by
Raskin Stanley A and Raskin Kathleen M
Bought by
Goulet Grant R and Lemire Lindsay A
Current Estimated Value
Home Financials for this Owner
Home Financials are based on the most recent Mortgage that was taken out on this home.
Original Mortgage
$189,349
Outstanding Balance
$125,774
Interest Rate
4.48%
Mortgage Type
Purchase Money Mortgage
Estimated Equity
$304,514
Create a Home Valuation Report for This Property
The Home Valuation Report is an in-depth analysis detailing your home's value as well as a comparison with similar homes in the area
Home Values in the Area
Average Home Value in this Area
Purchase History
| Date | Buyer | Sale Price | Title Company |
|---|---|---|---|
| Goulet Grant R | $191,900 | -- |
Source: Public Records
Mortgage History
| Date | Status | Borrower | Loan Amount |
|---|---|---|---|
| Open | Goulet Grant R | $189,349 |
Source: Public Records
Tax History Compared to Growth
Tax History
| Year | Tax Paid | Tax Assessment Tax Assessment Total Assessment is a certain percentage of the fair market value that is determined by local assessors to be the total taxable value of land and additions on the property. | Land | Improvement |
|---|---|---|---|---|
| 2024 | $9,083 | $357,300 | $145,600 | $211,700 |
| 2023 | $7,575 | $357,300 | $145,600 | $211,700 |
| 2022 | $6,967 | $357,300 | $145,600 | $211,700 |
| 2021 | $6,432 | $204,200 | $83,100 | $121,100 |
| 2020 | $5,983 | $204,200 | $83,100 | $121,100 |
| 2019 | $6,351 | $204,200 | $83,100 | $121,100 |
| 2018 | $6,157 | $204,200 | $83,100 | $121,100 |
| 2017 | $6,557 | $204,200 | $83,100 | $121,100 |
| 2016 | $5,766 | $170,300 | $60,600 | $109,700 |
| 2015 | $5,686 | $173,200 | $63,600 | $109,600 |
| 2014 | $5,851 | $173,200 | $63,600 | $109,600 |
| 2013 | $5,461 | $173,200 | $63,600 | $109,600 |
Source: Public Records
Map
Nearby Homes
- 19 Sullivan Dr
- 10 Lane Dr
- 2 Cheryl Dr
- 1 1/2 Bartlett St
- 15 Sullivan Dr
- 422 Dawn Dr Unit 23
- 427 Dawn Dr Unit 15
- 111 Glass St
- 307 Dearborn Rd
- 12-14 Church St Unit 12,14
- 100 Main St Unit M10
- 100 Main St Unit 204
- 9 Pine Acres Rd
- 4 Rodger Rd
- 15 Main St
- 7 Ferry St
- 233 Pembroke St
- 259 Pembroke St
- 101 4th Range Rd Unit 4
- 5 Catamount Hill Dr