Estimated Value: $113,389 - $341,000
--
Bed
--
Bath
1,116
Sq Ft
$195/Sq Ft
Est. Value
About This Home
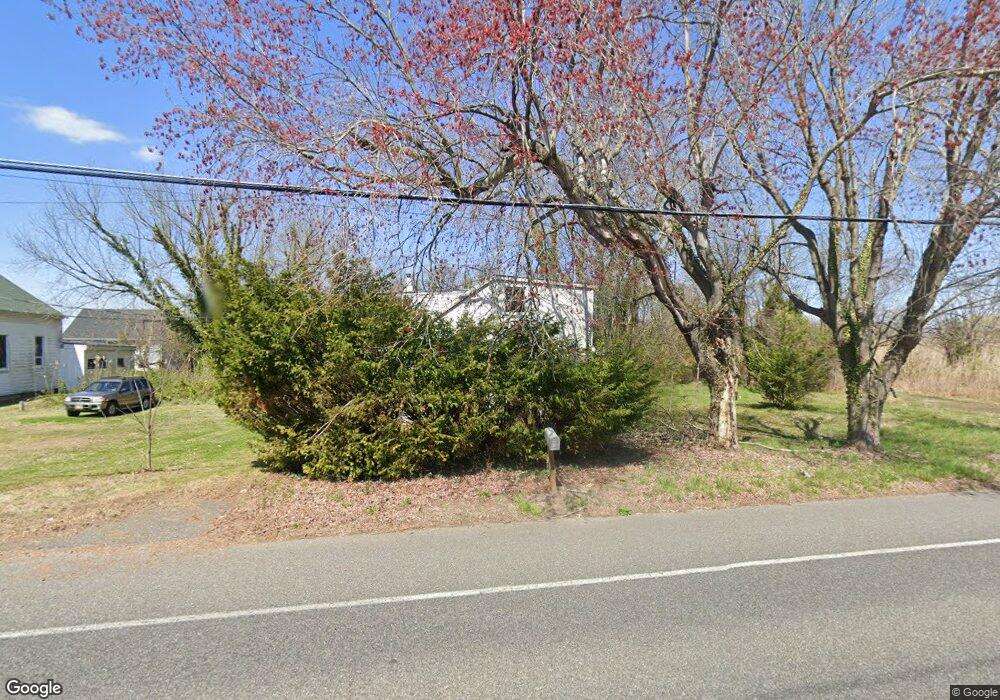
This home is located at 57 Route 45 Unit 57A, Salem, NJ 08079 and is currently estimated at $217,347, approximately $194 per square foot. 57 Route 45 Unit 57A is a home located in Salem County with nearby schools including Mannington Township School.
Ownership History
Date
Name
Owned For
Owner Type
Purchase Details
Closed on
May 28, 2024
Sold by
Choices Enterprises Llc
Bought by
Weber Investment Group Llc
Current Estimated Value
Purchase Details
Closed on
May 1, 2024
Sold by
Nina Kahn Llc
Bought by
Choices Enterprises Llc
Purchase Details
Closed on
Nov 20, 2017
Sold by
Fnma
Bought by
Nina Khan Llc
Purchase Details
Closed on
Jul 14, 2017
Sold by
Everbank
Bought by
Federal National Mortgage Association
Create a Home Valuation Report for This Property
The Home Valuation Report is an in-depth analysis detailing your home's value as well as a comparison with similar homes in the area
Home Values in the Area
Average Home Value in this Area
Purchase History
| Date | Buyer | Sale Price | Title Company |
|---|---|---|---|
| Weber Investment Group Llc | $45,000 | Salem Oak Title | |
| Choices Enterprises Llc | -- | None Listed On Document | |
| Choices Enterprises Llc | -- | None Listed On Document | |
| Nina Khan Llc | $4,650 | -- | |
| Federal National Mortgage Association | -- | None Available |
Source: Public Records
Tax History Compared to Growth
Tax History
| Year | Tax Paid | Tax Assessment Tax Assessment Total Assessment is a certain percentage of the fair market value that is determined by local assessors to be the total taxable value of land and additions on the property. | Land | Improvement |
|---|---|---|---|---|
| 2025 | $3,227 | $92,800 | $22,200 | $70,600 |
| 2024 | $3,203 | $92,800 | $22,200 | $70,600 |
| 2023 | $3,203 | $92,800 | $22,200 | $70,600 |
| 2022 | $3,217 | $92,800 | $22,200 | $70,600 |
| 2021 | $3,140 | $92,800 | $22,200 | $70,600 |
| 2020 | $2,951 | $92,800 | $22,200 | $70,600 |
| 2019 | $2,873 | $92,800 | $22,200 | $70,600 |
| 2018 | $2,741 | $92,800 | $22,200 | $70,600 |
| 2017 | $2,668 | $92,800 | $22,200 | $70,600 |
| 2016 | $2,533 | $92,800 | $22,200 | $70,600 |
| 2015 | $2,341 | $92,800 | $22,200 | $70,600 |
| 2014 | $2,269 | $92,800 | $22,200 | $70,600 |
Source: Public Records
Map
Nearby Homes