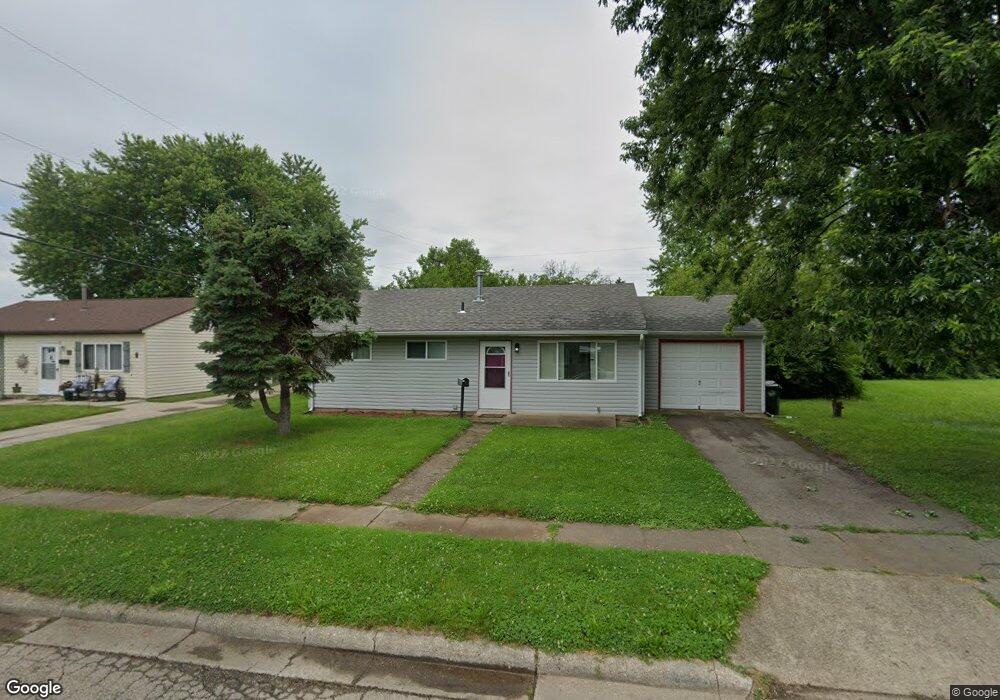
57 Rowland Dr Fairborn, OH 45324
Estimated Value: $143,000 - $150,000
3
Beds
1
Bath
816
Sq Ft
$178/Sq Ft
Est. Value
About This Home
This home is located at 57 Rowland Dr, Fairborn, OH 45324 and is currently estimated at $145,588, approximately $178 per square foot. 57 Rowland Dr is a home located in Greene County with nearby schools including Fairborn Primary School, Fairborn Intermediate School, and Fairborn Middle School.
Ownership History
Date
Name
Owned For
Owner Type
Purchase Details
Closed on
Feb 26, 2021
Sold by
Vazquez Adrian and Vazquez Vanessa L
Bought by
Childress Roger
Current Estimated Value
Home Financials for this Owner
Home Financials are based on the most recent Mortgage that was taken out on this home.
Original Mortgage
$97,000
Outstanding Balance
$85,760
Interest Rate
2.7%
Mortgage Type
New Conventional
Estimated Equity
$59,828
Purchase Details
Closed on
May 21, 2014
Sold by
Kaws Holdings Llc
Bought by
Vazquez Adrian and Vazquez Vanessa L
Home Financials for this Owner
Home Financials are based on the most recent Mortgage that was taken out on this home.
Original Mortgage
$40,000
Interest Rate
4.34%
Mortgage Type
Unknown
Purchase Details
Closed on
Oct 2, 2013
Sold by
Schumacher Sheila L
Bought by
Kaws Holdings Llc
Create a Home Valuation Report for This Property
The Home Valuation Report is an in-depth analysis detailing your home's value as well as a comparison with similar homes in the area
Home Values in the Area
Average Home Value in this Area
Purchase History
| Date | Buyer | Sale Price | Title Company |
|---|---|---|---|
| Childress Roger | $100,000 | First American Mortgage Sln | |
| Vazquez Adrian | $50,000 | None Available | |
| Kaws Holdings Llc | $23,000 | None Available |
Source: Public Records
Mortgage History
| Date | Status | Borrower | Loan Amount |
|---|---|---|---|
| Open | Childress Roger | $97,000 | |
| Previous Owner | Vazquez Adrian | $40,000 |
Source: Public Records
Tax History
| Year | Tax Paid | Tax Assessment Tax Assessment Total Assessment is a certain percentage of the fair market value that is determined by local assessors to be the total taxable value of land and additions on the property. | Land | Improvement |
|---|---|---|---|---|
| 2024 | $1,482 | $41,590 | $8,090 | $33,500 |
| 2023 | $1,486 | $41,590 | $8,090 | $33,500 |
| 2022 | $1,454 | $26,160 | $5,780 | $20,380 |
| 2021 | $1,145 | $19,840 | $5,780 | $14,060 |
| 2020 | $1,151 | $19,840 | $5,780 | $14,060 |
| 2019 | $1,049 | $18,090 | $5,800 | $12,290 |
| 2018 | $1,060 | $18,090 | $5,800 | $12,290 |
| 2017 | $1,060 | $18,090 | $5,800 | $12,290 |
| 2016 | $1,061 | $18,100 | $5,800 | $12,300 |
| 2015 | $1,011 | $18,100 | $5,800 | $12,300 |
| 2014 | $978 | $18,100 | $5,800 | $12,300 |
Source: Public Records
Map
Nearby Homes
- 153 Diana Ln N
- 818 Flintridge Dr
- 849 Flintridge Dr
- 437 Kirkwood Dr
- 406 Chapelgate Dr
- 139 Hower Ln
- 308 E Xenia Dr
- 38 Lindway Dr
- 323 Mann Ave
- 112 E Xenia Dr
- 35 S Grand Ave Unit 33
- 1108 Lexington Ave
- 388-390 Morris Dr Unit 388
- 12 Canova Ct
- 000 Morris Dr
- 45 Regina Dr
- 112 Mann Ave
- 315 Greene St
- 313 Archer Dr
- 261 Archer Dr
Your Personal Tour Guide
Ask me questions while you tour the home.