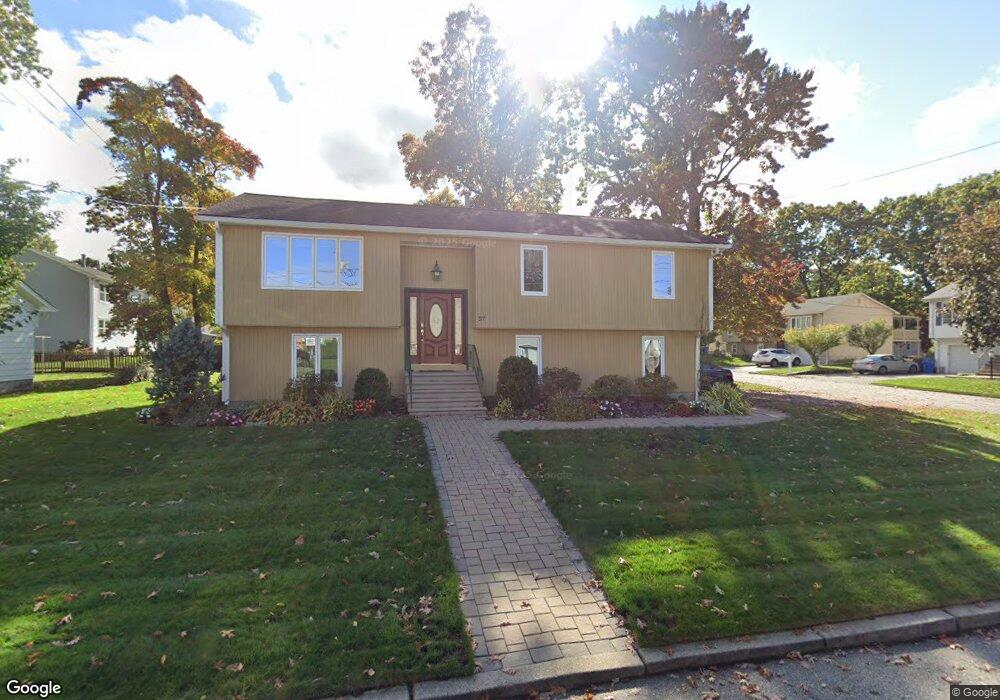
57 Rutland St Cranston, RI 02920
Budlong NeighborhoodEstimated Value: $434,000 - $512,000
3
Beds
3
Baths
1,248
Sq Ft
$380/Sq Ft
Est. Value
About This Home
This home is located at 57 Rutland St, Cranston, RI 02920 and is currently estimated at $474,538, approximately $380 per square foot. 57 Rutland St is a home located in Providence County with nearby schools including Woodridge Elementary School, Western Hills Middle School, and Cranston High School West.
Ownership History
Date
Name
Owned For
Owner Type
Purchase Details
Closed on
Jun 20, 2018
Sold by
Gebhart Paul R and Gebhart Diane J
Bought by
Paul Gebhart 2018 Lt and Diane Gebhart 2018 Lt
Current Estimated Value
Create a Home Valuation Report for This Property
The Home Valuation Report is an in-depth analysis detailing your home's value as well as a comparison with similar homes in the area
Home Values in the Area
Average Home Value in this Area
Purchase History
| Date | Buyer | Sale Price | Title Company |
|---|---|---|---|
| Paul Gebhart 2018 Lt | -- | -- |
Source: Public Records
Mortgage History
| Date | Status | Borrower | Loan Amount |
|---|---|---|---|
| Previous Owner | Paul Gebhart 2018 Lt | $121,400 | |
| Previous Owner | Paul Gebhart 2018 Lt | $50,000 | |
| Previous Owner | Paul Gebhart 2018 Lt | $127,500 | |
| Previous Owner | Paul Gebhart 2018 Lt | $111,000 |
Source: Public Records
Tax History Compared to Growth
Tax History
| Year | Tax Paid | Tax Assessment Tax Assessment Total Assessment is a certain percentage of the fair market value that is determined by local assessors to be the total taxable value of land and additions on the property. | Land | Improvement |
|---|---|---|---|---|
| 2025 | $5,441 | $392,000 | $106,900 | $285,100 |
| 2024 | $5,335 | $392,000 | $106,900 | $285,100 |
| 2023 | $4,944 | $261,600 | $73,700 | $187,900 |
| 2022 | $4,842 | $261,600 | $73,700 | $187,900 |
| 2021 | $4,709 | $261,600 | $73,700 | $187,900 |
| 2020 | $4,902 | $236,000 | $77,200 | $158,800 |
| 2019 | $4,902 | $236,000 | $77,200 | $158,800 |
| 2018 | $4,788 | $236,000 | $77,200 | $158,800 |
| 2017 | $4,898 | $213,500 | $70,200 | $143,300 |
| 2016 | $4,793 | $213,500 | $70,200 | $143,300 |
| 2015 | $4,793 | $213,500 | $70,200 | $143,300 |
| 2014 | $4,321 | $189,200 | $70,200 | $119,000 |
Source: Public Records
Map
Nearby Homes
- 210 Hyde St
- 69 W View Ave
- 0 Rutland St
- 99 Salem Ave
- 21 Charles St
- 71 Norton Ave
- 446 Budlong Rd
- 141 Glen Ridge Rd
- 111 Belgium St
- 34 Aldrich Ave
- 80 Phenix Ave
- 46 Lilyana Way
- 10 Sheffield Rd
- 275 Meshanticut Valley Pkwy
- 54 Randall St
- 92 Rhode Island St
- 333 Phenix Ave
- 46 Roslyn Ave
- 86 Sherwood St
- 56 Scituate Ave