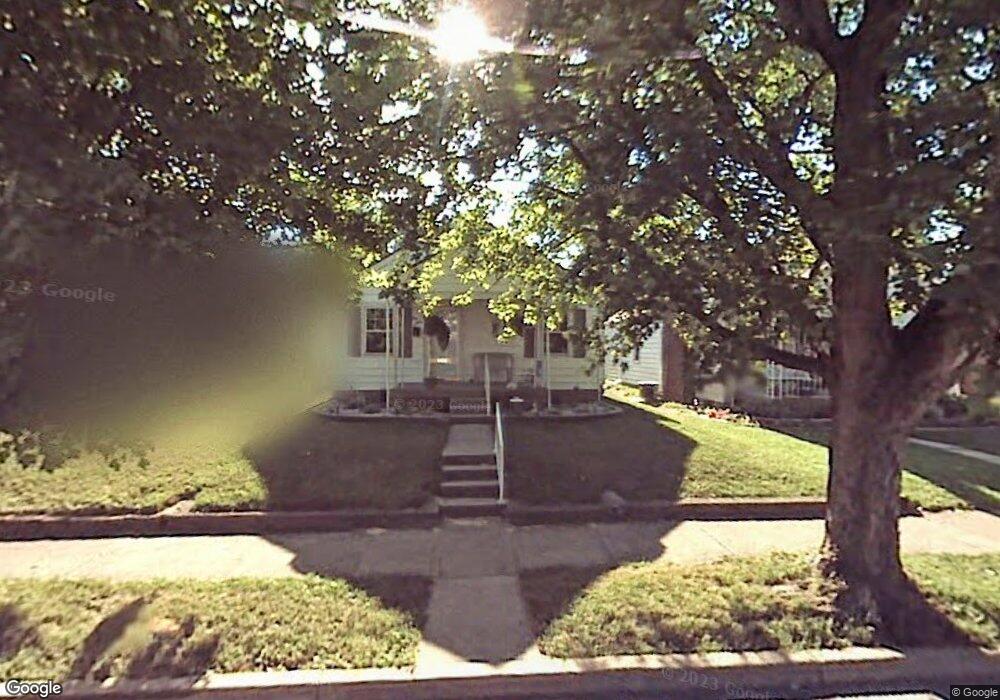
57 S 10th Ave Beech Grove, IN 46107
Estimated Value: $186,000 - $196,912
3
Beds
1
Bath
1,906
Sq Ft
$101/Sq Ft
Est. Value
About This Home
This home is located at 57 S 10th Ave, Beech Grove, IN 46107 and is currently estimated at $191,978, approximately $100 per square foot. 57 S 10th Ave is a home located in Marion County with nearby schools including Hornet Park Elementary School, Central Elementary School, and South Grove Intermediate School.
Ownership History
Date
Name
Owned For
Owner Type
Purchase Details
Closed on
Apr 28, 2010
Sold by
Apter Properties Llc
Bought by
Mascari Daniel V
Current Estimated Value
Home Financials for this Owner
Home Financials are based on the most recent Mortgage that was taken out on this home.
Original Mortgage
$78,452
Outstanding Balance
$52,519
Interest Rate
5.5%
Mortgage Type
FHA
Estimated Equity
$139,459
Purchase Details
Closed on
Feb 11, 2010
Sold by
Secretary Of Housing & Urban Development
Bought by
Apter Properties Llc
Purchase Details
Closed on
Aug 4, 2009
Sold by
National City Mortgage
Bought by
Secretary Of Housing & Urban Development
Purchase Details
Closed on
Jun 29, 2009
Sold by
Neice Joshua J and Velotta Mindy M
Bought by
National City Mortgage
Purchase Details
Closed on
Jan 26, 2007
Sold by
Neice Joshua J
Bought by
Neice Joshua J and Velotta Mindy M
Home Financials for this Owner
Home Financials are based on the most recent Mortgage that was taken out on this home.
Original Mortgage
$92,263
Interest Rate
6.19%
Mortgage Type
FHA
Purchase Details
Closed on
May 24, 2005
Sold by
Knuckles Grace T
Bought by
Neice Joshua J
Home Financials for this Owner
Home Financials are based on the most recent Mortgage that was taken out on this home.
Original Mortgage
$16,980
Interest Rate
6.05%
Mortgage Type
Stand Alone Second
Purchase Details
Closed on
May 12, 2005
Sold by
Knuckles Grace T
Bought by
Neice Joshua J
Home Financials for this Owner
Home Financials are based on the most recent Mortgage that was taken out on this home.
Original Mortgage
$16,980
Interest Rate
6.05%
Mortgage Type
Stand Alone Second
Create a Home Valuation Report for This Property
The Home Valuation Report is an in-depth analysis detailing your home's value as well as a comparison with similar homes in the area
Home Values in the Area
Average Home Value in this Area
Purchase History
| Date | Buyer | Sale Price | Title Company |
|---|---|---|---|
| Mascari Daniel V | -- | None Available | |
| Apter Properties Llc | -- | None Available | |
| Secretary Of Housing & Urban Development | -- | None Available | |
| National City Mortgage | $102,795 | None Available | |
| Neice Joshua J | -- | None Available | |
| Neice Joshua J | -- | None Available | |
| Neice Joshua J | -- | None Available |
Source: Public Records
Mortgage History
| Date | Status | Borrower | Loan Amount |
|---|---|---|---|
| Open | Mascari Daniel V | $78,452 | |
| Previous Owner | Neice Joshua J | $92,263 | |
| Previous Owner | Neice Joshua J | $16,980 | |
| Previous Owner | Neice Joshua J | $16,980 |
Source: Public Records
Tax History
| Year | Tax Paid | Tax Assessment Tax Assessment Total Assessment is a certain percentage of the fair market value that is determined by local assessors to be the total taxable value of land and additions on the property. | Land | Improvement |
|---|---|---|---|---|
| 2025 | $2,294 | $176,500 | $17,500 | $159,000 |
| 2024 | $2,018 | $171,200 | $17,500 | $153,700 |
| 2023 | $2,018 | $152,400 | $17,500 | $134,900 |
| 2022 | $1,915 | $140,600 | $17,500 | $123,100 |
| 2021 | $1,537 | $119,000 | $17,500 | $101,500 |
| 2020 | $1,296 | $107,100 | $17,500 | $89,600 |
| 2019 | $1,196 | $102,200 | $14,400 | $87,800 |
| 2018 | $998 | $89,000 | $14,400 | $74,600 |
| 2017 | $992 | $87,000 | $14,400 | $72,600 |
| 2016 | $952 | $84,400 | $14,400 | $70,000 |
| 2014 | $821 | $76,300 | $14,400 | $61,900 |
| 2013 | $715 | $68,000 | $14,400 | $53,600 |
Source: Public Records
Map
Nearby Homes
Your Personal Tour Guide
Ask me questions while you tour the home.