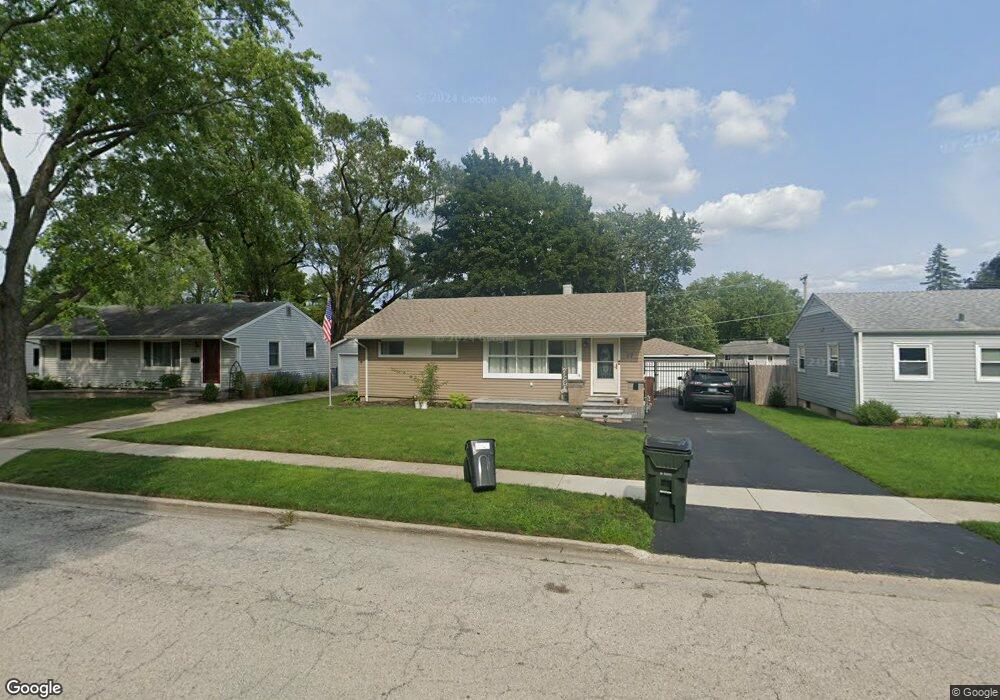
57 S Garfield Ave Mundelein, IL 60060
Estimated Value: $277,000 - $290,000
3
Beds
1
Bath
936
Sq Ft
$305/Sq Ft
Est. Value
About This Home
This home is located at 57 S Garfield Ave, Mundelein, IL 60060 and is currently estimated at $285,336, approximately $304 per square foot. 57 S Garfield Ave is a home located in Lake County with nearby schools including Washington Early Learning Center, Mechanics Grove Elementary School, and Carl Sandburg Middle School.
Ownership History
Date
Name
Owned For
Owner Type
Purchase Details
Closed on
Jan 24, 2006
Sold by
Cuna Jose G
Bought by
Cuna Jose G and Cuna Marilu A
Current Estimated Value
Home Financials for this Owner
Home Financials are based on the most recent Mortgage that was taken out on this home.
Original Mortgage
$127,000
Interest Rate
6.34%
Mortgage Type
New Conventional
Purchase Details
Closed on
Sep 12, 2001
Sold by
Cuna Jose G and Cuna Marilu A
Bought by
Cuna Jose G
Home Financials for this Owner
Home Financials are based on the most recent Mortgage that was taken out on this home.
Original Mortgage
$158,750
Interest Rate
6.92%
Mortgage Type
Stand Alone First
Purchase Details
Closed on
Feb 26, 1996
Sold by
Figueroa Loretta S and Combs Loretta S
Bought by
Cuna Jose G and Cuna Marilu A
Home Financials for this Owner
Home Financials are based on the most recent Mortgage that was taken out on this home.
Original Mortgage
$123,500
Interest Rate
7.2%
Create a Home Valuation Report for This Property
The Home Valuation Report is an in-depth analysis detailing your home's value as well as a comparison with similar homes in the area
Home Values in the Area
Average Home Value in this Area
Purchase History
| Date | Buyer | Sale Price | Title Company |
|---|---|---|---|
| Cuna Jose G | -- | Lawyers | |
| Cuna Jose G | -- | -- | |
| Cuna Jose G | $130,000 | -- |
Source: Public Records
Mortgage History
| Date | Status | Borrower | Loan Amount |
|---|---|---|---|
| Closed | Cuna Jose G | $127,000 | |
| Closed | Cuna Jose G | $158,750 | |
| Closed | Cuna Jose G | $123,500 |
Source: Public Records
Tax History Compared to Growth
Tax History
| Year | Tax Paid | Tax Assessment Tax Assessment Total Assessment is a certain percentage of the fair market value that is determined by local assessors to be the total taxable value of land and additions on the property. | Land | Improvement |
|---|---|---|---|---|
| 2024 | $6,491 | $75,441 | $16,531 | $58,910 |
| 2023 | $6,195 | $69,124 | $15,147 | $53,977 |
| 2022 | $6,195 | $63,584 | $14,445 | $49,139 |
| 2021 | $5,917 | $61,357 | $13,939 | $47,418 |
| 2020 | $5,814 | $59,668 | $13,555 | $46,113 |
| 2019 | $5,623 | $57,706 | $13,109 | $44,597 |
| 2018 | $4,839 | $50,525 | $12,453 | $38,072 |
| 2017 | $4,809 | $48,935 | $12,061 | $36,874 |
| 2016 | $4,634 | $46,476 | $11,455 | $35,021 |
| 2015 | $4,498 | $43,570 | $10,739 | $32,831 |
| 2014 | $4,319 | $42,711 | $10,644 | $32,067 |
| 2012 | $4,419 | $43,091 | $10,739 | $32,352 |
Source: Public Records
Map
Nearby Homes
- 29746 U S 45
- 116 S Pershing Ave
- 207 N Idlewild Ave
- 331 Plaza Cir
- 26980 N Pierre Dr
- 250 N Fairlawn Ave
- 1297 Spalding Dr
- 1305 Spalding Dr
- 281 N Shaddle Ave
- 26892 N Iride Dr
- 26220 N Midlothian Rd
- 547 N Ridgemoor Ave
- 19738 W Martin Dr
- 841 Wilcox St
- 19925 W Il Route 60
- 619 N California Ave Unit 1
- 742 N Lake St
- 215 Brice Ave
- 422 James Ave
- 659 E Maple Ave
- 51 S Garfield Ave
- 63 S Garfield Ave
- 45 S Garfield Ave
- 120 W Orchard St
- 58 S Lincoln Ave
- 52 S Lincoln Ave
- 64 S Lincoln Ave
- 46 S Lincoln Ave
- 39 S Garfield Ave
- 110 W Orchard St
- 64 S Garfield Ave
- 58 S Garfield Ave
- 70 S Garfield Ave
- 40 S Lincoln Ave
- 46 S Garfield Ave
- 27 S Garfield Ave
- 104 S Lincoln Ave
- 28 S Lincoln Ave
- 40 S Garfield Ave
- 57 S Prairie Ave