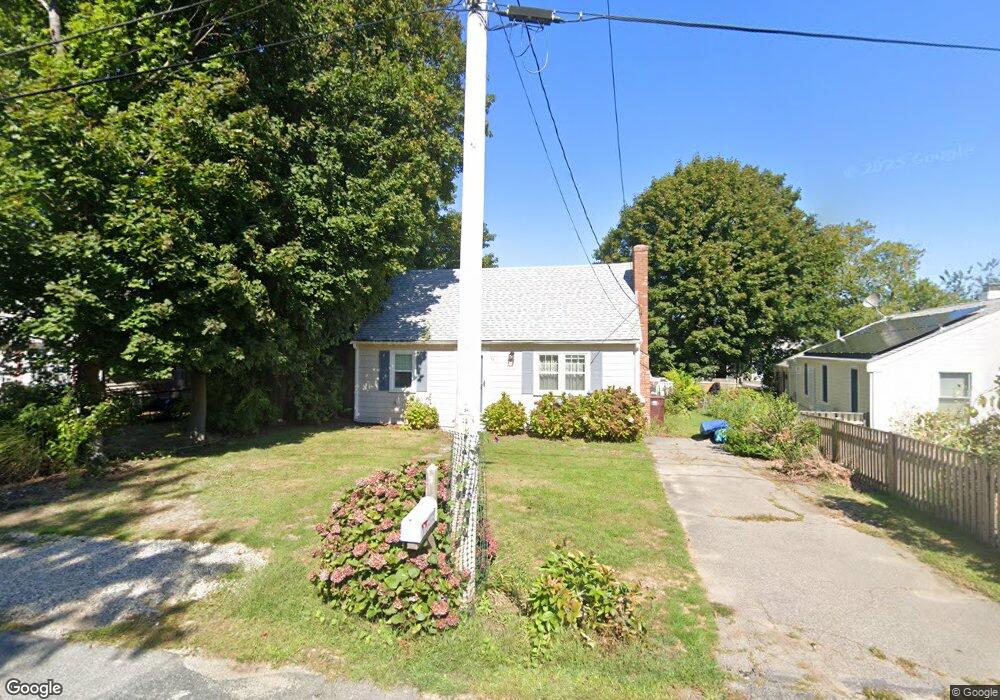
57 Scituate Ave Scituate, MA 02066
Estimated Value: $691,000 - $823,000
3
Beds
2
Baths
1,392
Sq Ft
$541/Sq Ft
Est. Value
About This Home
This home is located at 57 Scituate Ave, Scituate, MA 02066 and is currently estimated at $753,107, approximately $541 per square foot. 57 Scituate Ave is a home located in Plymouth County with nearby schools including Jenkins Elementary School, Lester J. Gates Middle School, and Scituate High School.
Ownership History
Date
Name
Owned For
Owner Type
Purchase Details
Closed on
Jan 12, 2022
Sold by
Perkins Constance G
Bought by
Eason-Lefort Amy
Current Estimated Value
Home Financials for this Owner
Home Financials are based on the most recent Mortgage that was taken out on this home.
Original Mortgage
$399,628
Outstanding Balance
$368,017
Interest Rate
3.05%
Mortgage Type
FHA
Estimated Equity
$385,090
Purchase Details
Closed on
Mar 14, 1988
Sold by
Robson Janice A
Bought by
Perkins Constance G
Home Financials for this Owner
Home Financials are based on the most recent Mortgage that was taken out on this home.
Original Mortgage
$77,000
Interest Rate
10.11%
Mortgage Type
Purchase Money Mortgage
Create a Home Valuation Report for This Property
The Home Valuation Report is an in-depth analysis detailing your home's value as well as a comparison with similar homes in the area
Home Values in the Area
Average Home Value in this Area
Purchase History
| Date | Buyer | Sale Price | Title Company |
|---|---|---|---|
| Eason-Lefort Amy | $407,000 | None Available | |
| Perkins Constance G | $150,000 | -- |
Source: Public Records
Mortgage History
| Date | Status | Borrower | Loan Amount |
|---|---|---|---|
| Open | Eason-Lefort Amy | $399,628 | |
| Previous Owner | Perkins Constance G | $107,600 | |
| Previous Owner | Perkins Constance G | $83,000 | |
| Previous Owner | Perkins Constance G | $35,274 | |
| Previous Owner | Perkins Constance G | $77,000 |
Source: Public Records
Tax History
| Year | Tax Paid | Tax Assessment Tax Assessment Total Assessment is a certain percentage of the fair market value that is determined by local assessors to be the total taxable value of land and additions on the property. | Land | Improvement |
|---|---|---|---|---|
| 2025 | $6,108 | $611,400 | $384,100 | $227,300 |
| 2024 | $5,927 | $572,100 | $349,100 | $223,000 |
| 2023 | $5,533 | $531,200 | $317,400 | $213,800 |
| 2022 | $5,533 | $438,400 | $258,900 | $179,500 |
| 2021 | $5,169 | $387,800 | $234,300 | $153,500 |
| 2020 | $5,015 | $371,500 | $225,200 | $146,300 |
| 2019 | $4,959 | $360,900 | $220,800 | $140,100 |
| 2018 | $5,167 | $370,400 | $238,700 | $131,700 |
| 2017 | $5,078 | $360,400 | $228,700 | $131,700 |
| 2016 | $4,815 | $340,500 | $208,800 | $131,700 |
| 2015 | $4,331 | $330,600 | $198,900 | $131,700 |
Source: Public Records
Map
Nearby Homes
- 86 Hatherly Rd
- 105 Turner Rd
- 32 Barker Rd Unit 3
- 23 Oceanside Dr
- 33 Oceanside Dr
- 92 Marion Rd
- 11 Brookline Rd
- 38 Lauren Ln
- 25 Morton Place
- 23 Sunset Rd
- 46 Tilden Rd
- 91 Front St Unit 106
- 50 First Parish Rd
- 49 Jackson Rd
- 20 Lee Ave
- 1 Washington Ln
- 20 Lawson Rd
- 55 Crescent Ave
- 74 Branch St Unit 15
- 111 Elm St
Your Personal Tour Guide
Ask me questions while you tour the home.