57 Thames Height Ln Groton, CT 06340
Estimated Value: $283,092 - $322,000
2
Beds
2
Baths
1,111
Sq Ft
$272/Sq Ft
Est. Value
About This Home
This home is located at 57 Thames Height Ln, Groton, CT 06340 and is currently estimated at $302,523, approximately $272 per square foot. 57 Thames Height Ln is a home located in New London County with nearby schools including Pleasant Valley School, Groton Middle School, and Robert E. Fitch High School.
Ownership History
Date
Name
Owned For
Owner Type
Purchase Details
Closed on
Sep 1, 2006
Sold by
Relocation Prudential
Bought by
Bunkley Cassandra
Current Estimated Value
Home Financials for this Owner
Home Financials are based on the most recent Mortgage that was taken out on this home.
Original Mortgage
$204,000
Outstanding Balance
$123,574
Interest Rate
6.83%
Estimated Equity
$178,949
Purchase Details
Closed on
Oct 15, 2004
Sold by
Behan James
Bought by
Prudential Res Svcs Lp
Home Financials for this Owner
Home Financials are based on the most recent Mortgage that was taken out on this home.
Original Mortgage
$127,200
Interest Rate
5.8%
Purchase Details
Closed on
Feb 27, 2004
Sold by
Eybel Ernest
Bought by
Behan James
Purchase Details
Closed on
Feb 29, 2000
Sold by
Teprovich Thomas J and Teprovich Janine
Bought by
Eybel Ernest P
Purchase Details
Closed on
Mar 28, 1996
Sold by
Groton Landing Llc
Bought by
Teprovich Thomas J and Teprovich Janine
Create a Home Valuation Report for This Property
The Home Valuation Report is an in-depth analysis detailing your home's value as well as a comparison with similar homes in the area
Home Values in the Area
Average Home Value in this Area
Purchase History
| Date | Buyer | Sale Price | Title Company |
|---|---|---|---|
| Bunkley Cassandra | $255,000 | -- | |
| Prudential Res Svcs Lp | $159,000 | -- | |
| Behan James | $145,000 | -- | |
| Eybel Ernest P | $92,000 | -- | |
| Teprovich Thomas J | $92,900 | -- |
Source: Public Records
Mortgage History
| Date | Status | Borrower | Loan Amount |
|---|---|---|---|
| Open | Teprovich Thomas J | $123,750 | |
| Open | Teprovich Thomas J | $204,000 | |
| Previous Owner | Teprovich Thomas J | $127,200 |
Source: Public Records
Tax History
| Year | Tax Paid | Tax Assessment Tax Assessment Total Assessment is a certain percentage of the fair market value that is determined by local assessors to be the total taxable value of land and additions on the property. | Land | Improvement |
|---|---|---|---|---|
| 2025 | $2,964 | $104,510 | $31,353 | $73,157 |
| 2024 | $2,799 | $104,510 | $31,353 | $73,157 |
| 2023 | $2,696 | $104,510 | $0 | $104,510 |
| 2022 | $2,631 | $104,510 | $0 | $104,510 |
| 2021 | $3,155 | $105,490 | $0 | $105,490 |
| 2020 | $3,163 | $105,490 | $0 | $105,490 |
| 2019 | $3,034 | $105,490 | $0 | $105,490 |
| 2018 | $3,022 | $105,490 | $0 | $105,490 |
| 2017 | $2,862 | $105,490 | $0 | $105,490 |
| 2016 | $2,688 | $105,280 | $0 | $105,280 |
| 2015 | $2,601 | $105,280 | $0 | $105,280 |
| 2014 | $2,504 | $105,280 | $0 | $105,280 |
Source: Public Records
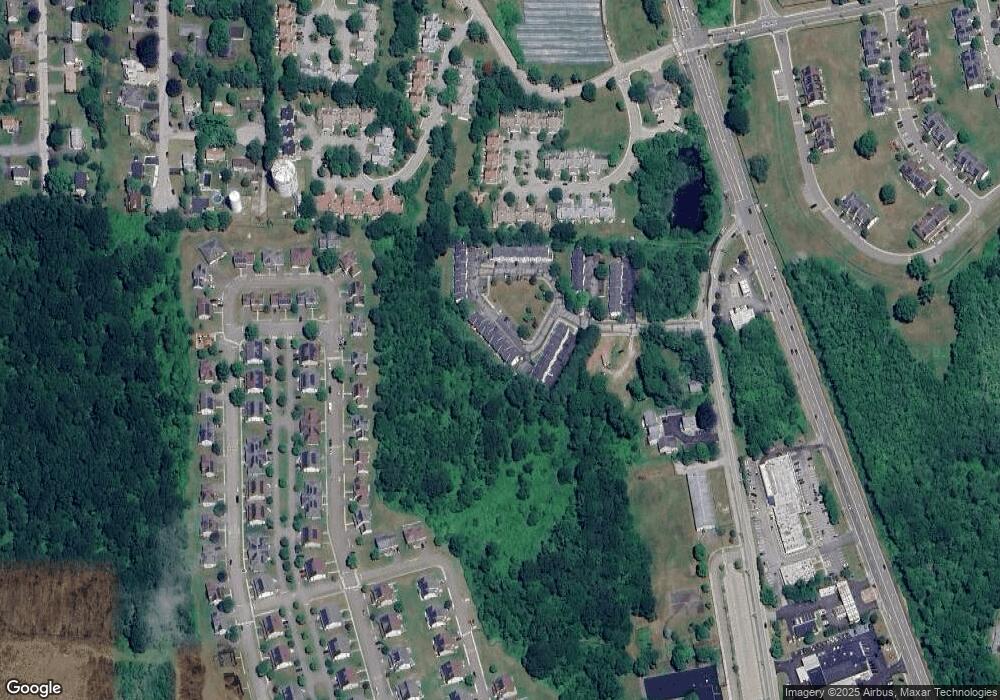
Map
Nearby Homes
- 435 Military Hwy Unit 449
- 141 Starr Hill Rd
- 310 Lestertown Rd
- 22 Toll Gate Rd
- 0 Briar Hill Rd Unit 24148389
- 41 Riverview Ave
- 125 Murphys Dr Unit 125
- 1260 Route 12
- 0 Bonnie Cir
- 99 Pamela Ave
- 517-571 Gold Star Hwy
- 108 Thames St
- 85 Crown Knoll Ct Unit 110
- 279 Bridge St Unit 10
- 90 Crown Knoll Ct Unit 136
- 132 Thames St Unit R
- 25 Morgan Ct
- 74 Crown Knoll Ct Unit 162
- 14 Rosemary St
- 130 Meridian St Unit 301
- 55 Thames Height Ln
- 59 Thames Height Ln
- 61 Thames Height Ln
- 53 Thames Height Ln
- 53 Thames Height Ln Unit 53
- 63 Thames Height Ln
- 63 Thames Height Ln Unit 63
- 51 Thames Height Ln
- 51 Thames Height Ln Unit 51
- 65 Thames Height Ln
- 67 Thames Height Ln
- 67 Thames Height Ln Unit 67
- 69 Thames Height Ln
- 41 Thames Height Ln
- 41 Thames Height Ln Unit 41
- 39 Thames Height Ln
- 39 Thames Height Ln Unit 39
- 49 Thames Height Ln
- 49 Thames Height Ln Unit 49
- 49 Thames Height Ln Unit 49
Your Personal Tour Guide
Ask me questions while you tour the home.