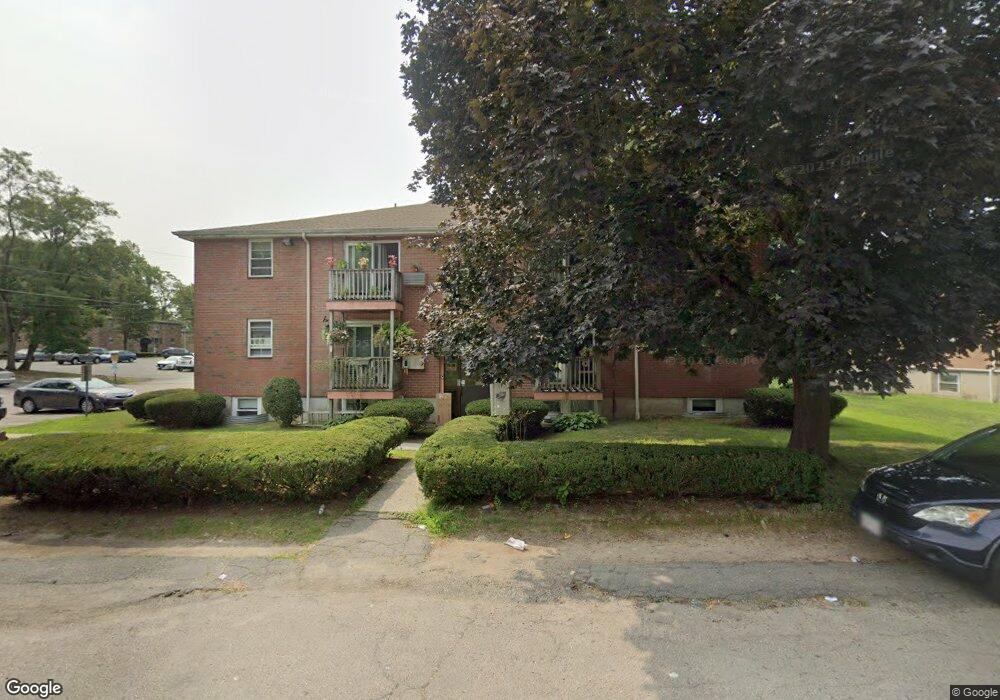
57 W Elm Terrace Unit 11 Brockton, MA 02301
Estimated Value: $179,000 - $287,000
1
Bed
1
Bath
603
Sq Ft
$351/Sq Ft
Est. Value
About This Home
This home is located at 57 W Elm Terrace Unit 11, Brockton, MA 02301 and is currently estimated at $211,841, approximately $351 per square foot. 57 W Elm Terrace Unit 11 is a home located in Plymouth County with nearby schools including Louis F Angelo Elementary School, Raymond K-8 Elementary School, and Hancock Elementary School.
Ownership History
Date
Name
Owned For
Owner Type
Purchase Details
Closed on
Sep 21, 2017
Sold by
Flaming Arrow Rt
Bought by
57 West Elm Terrace 11
Current Estimated Value
Purchase Details
Closed on
Jan 6, 2000
Sold by
Vanvanduong Hieu Van
Bought by
Flaming Arrow Rt and Petipas Patricia M
Purchase Details
Closed on
Jan 10, 1992
Sold by
Dime Sb Of Ny
Bought by
Duong Hieu
Home Financials for this Owner
Home Financials are based on the most recent Mortgage that was taken out on this home.
Original Mortgage
$23,200
Interest Rate
8.64%
Mortgage Type
Purchase Money Mortgage
Purchase Details
Closed on
Jan 24, 1989
Sold by
Schwartz Michael N
Bought by
Mason Patricia H
Home Financials for this Owner
Home Financials are based on the most recent Mortgage that was taken out on this home.
Original Mortgage
$67,000
Interest Rate
10.38%
Mortgage Type
Purchase Money Mortgage
Create a Home Valuation Report for This Property
The Home Valuation Report is an in-depth analysis detailing your home's value as well as a comparison with similar homes in the area
Home Values in the Area
Average Home Value in this Area
Purchase History
| Date | Buyer | Sale Price | Title Company |
|---|---|---|---|
| 57 West Elm Terrace 11 | -- | -- | |
| Flaming Arrow Rt | $29,000 | -- | |
| Duong Hieu | $29,000 | -- | |
| Mason Patricia H | $83,900 | -- |
Source: Public Records
Mortgage History
| Date | Status | Borrower | Loan Amount |
|---|---|---|---|
| Previous Owner | Mason Patricia H | $23,200 | |
| Previous Owner | Mason Patricia H | $67,000 |
Source: Public Records
Tax History Compared to Growth
Tax History
| Year | Tax Paid | Tax Assessment Tax Assessment Total Assessment is a certain percentage of the fair market value that is determined by local assessors to be the total taxable value of land and additions on the property. | Land | Improvement |
|---|---|---|---|---|
| 2025 | $1,935 | $159,800 | $0 | $159,800 |
| 2024 | $1,986 | $165,200 | $0 | $165,200 |
| 2023 | $1,847 | $142,300 | $0 | $142,300 |
| 2022 | $1,771 | $126,800 | $0 | $126,800 |
| 2021 | $1,621 | $111,800 | $0 | $111,800 |
| 2020 | $1,591 | $105,000 | $0 | $105,000 |
| 2019 | $1,417 | $91,200 | $0 | $91,200 |
| 2018 | $1,302 | $81,100 | $0 | $81,100 |
| 2017 | $1,257 | $78,100 | $0 | $78,100 |
| 2016 | $1,172 | $67,500 | $0 | $67,500 |
| 2015 | $1,124 | $61,940 | $0 | $61,940 |
| 2014 | $1,019 | $56,180 | $0 | $56,180 |
Source: Public Records
Map
Nearby Homes
- 57 W Elm Terrace Unit 10
- 57 W Elm Terrace Unit 9
- 57 W Elm Terrace Unit 8
- 57 W Elm Terrace Unit 7
- 57 W Elm Terrace Unit 6
- 57 W Elm Terrace Unit 5
- 57 W Elm Terrace Unit 4
- 57 W Elm Terrace Unit 3
- 57 W Elm Terrace Unit 2
- 57 W Elm Terrace Unit 1
- 58 W Elm Terrace
- 30 Auna Dr Unit 11
- 30 Auna Dr Unit 10
- 30 Auna Dr Unit 9
- 30 Auna Dr Unit 8
- 30 Auna Dr Unit 7
- 30 Auna Dr Unit 6
- 30 Auna Dr Unit 5
- 30 Auna Dr Unit 4
- 30 Auna Dr Unit 3