57 W Elm Terrace Unit 7 Brockton, MA 02301
About This Home
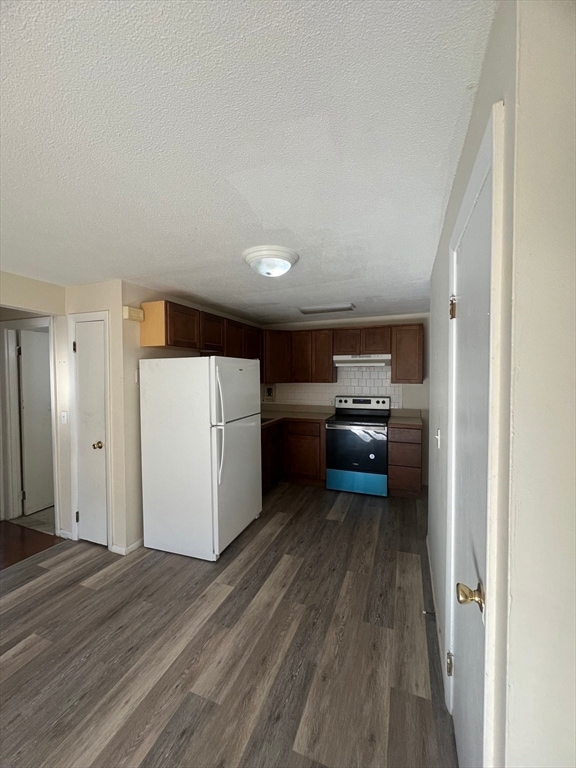
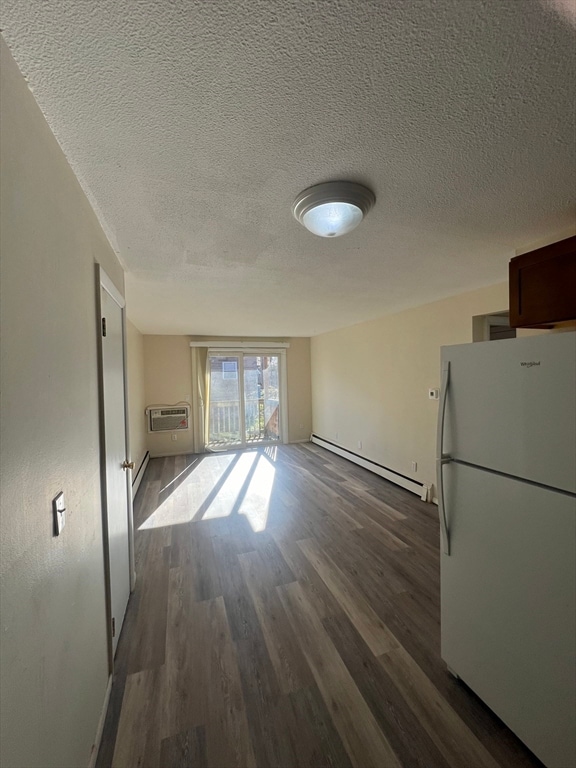
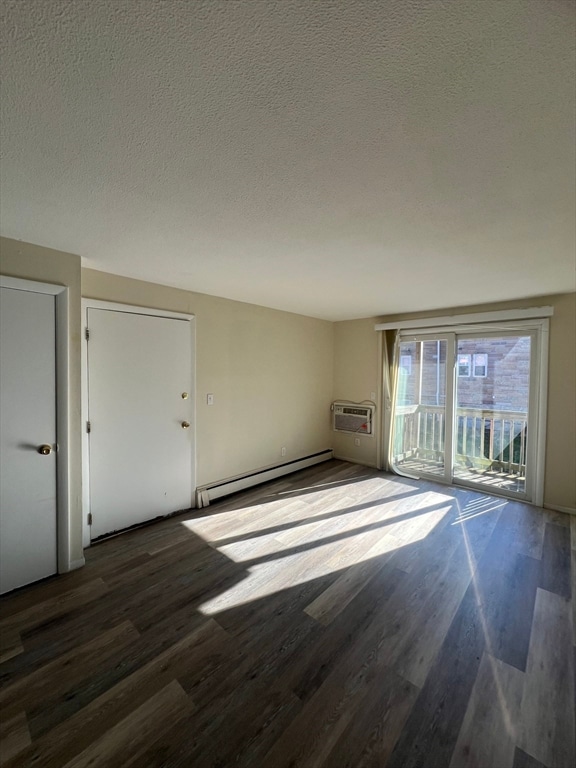
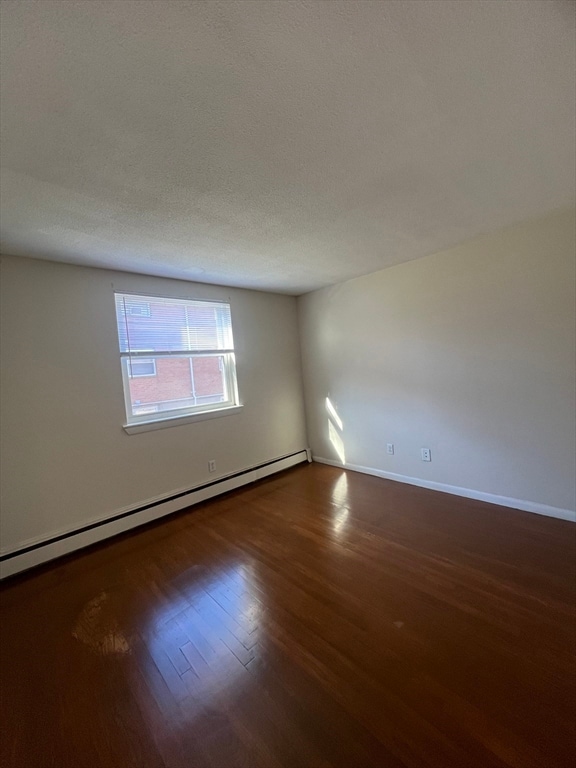
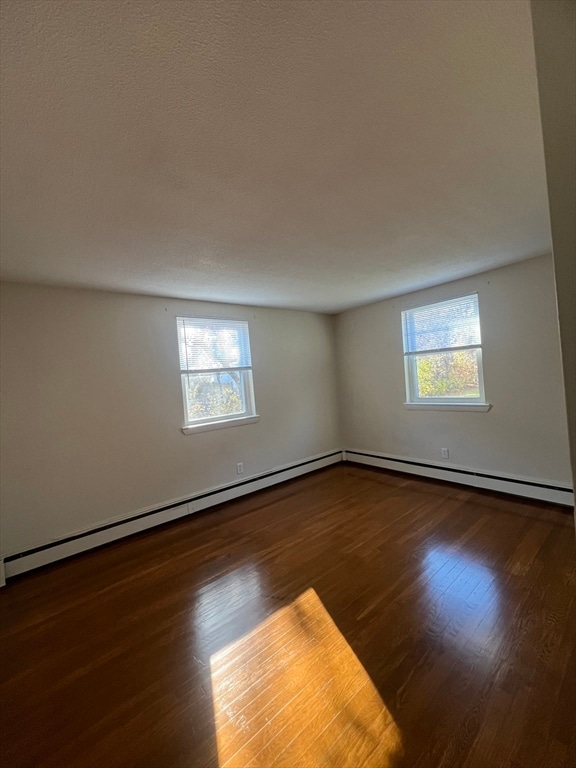
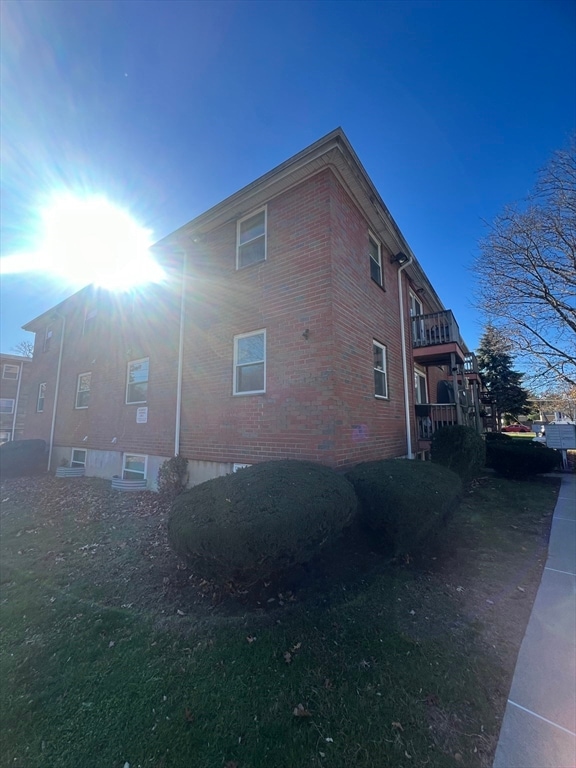
Well-kept 2-bedroom apartment located on Brockton’s desirable west side. Features include a small private porch, two generously sized bedrooms, and newer vinyl flooring throughout. Conveniently close to major highways, shopping, and local amenities. Great location with comfortable living!
Property Details
Home Type
- Multi-Family
Est. Annual Taxes
- $1,935
Year Built
- 1986
Parking
- 1 Car Parking Space
Home Design
- 603 Sq Ft Home
- Apartment
- Entry on the 1st floor
Bedrooms and Bathrooms
- 2 Bedrooms
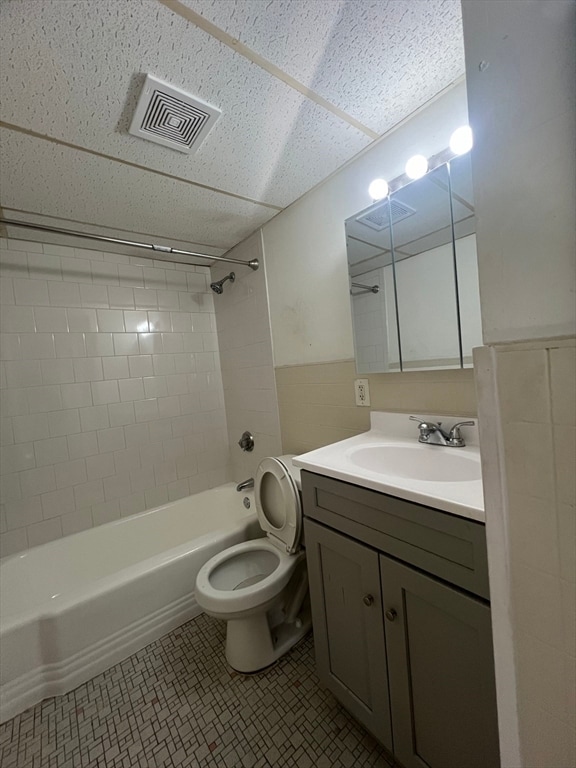
- 1 Full Bathroom
Utilities
- No Cooling
- Heating Available
Listing and Financial Details
- Security Deposit $1,600
- Rent includes heat, hot water
- Assessor Parcel Number M:031 R:816 S:,954325
Community Details
Overview
- Property has a Home Owners Association
Pet Policy
- No Pets Allowed
Map
Source: MLS Property Information Network (MLS PIN)
MLS Number: 73456273
APN: BROC-000031-000816
Disclaimer: Certain information contained herein is derived from information provided by parties other than Homes.com. All information provided is deemed reliable, but is not guaranteed to be accurate and should be independently verified.
![]() The property listing data and information, or the Images, set forth herein were provided to MLS Property Information Network, Inc. from third party sources, including sellers, lessors and public records, and were compiled by MLS Property Information Network, Inc. The property listing data and information, and the Images, are for the personal, non-commercial use of consumers having a good faith interest in purchasing or leasing listed properties of the type displayed to them and may not be used for any purpose other than to identify prospective properties which such consumers may have a good faith interest in purchasing or leasing. MLS Property Information Network, Inc. and its subscribers disclaim any and all representations and warranties as to the accuracy of the property listing data and information, or as to the accuracy of any of the Images, set forth herein.
The property listing data and information, or the Images, set forth herein were provided to MLS Property Information Network, Inc. from third party sources, including sellers, lessors and public records, and were compiled by MLS Property Information Network, Inc. The property listing data and information, and the Images, are for the personal, non-commercial use of consumers having a good faith interest in purchasing or leasing listed properties of the type displayed to them and may not be used for any purpose other than to identify prospective properties which such consumers may have a good faith interest in purchasing or leasing. MLS Property Information Network, Inc. and its subscribers disclaim any and all representations and warranties as to the accuracy of the property listing data and information, or as to the accuracy of any of the Images, set forth herein.
- 215 Belmont Ave Unit 1
- 285 W Elm St Unit 7
- 18 Minot Ave Unit 1
- 58 Brett St Unit 1
- 26 Madrid Square Unit 12
- 65 Arlington St Unit 9
- 65 Arlington St Unit 8
- 65 Arlington St
- 70 Weston St Unit 70 weston st
- 70 Weston St Unit 2
- 176 Green St Unit 2
- 140 Spring St Unit 1
- 47 W Elm St
- 54 Haverhill St
- 436 Warren Ave Unit 1F
- 47 Pleasant St
- 20 Haverhill St
- 51 W Rosseter St Unit 1
- 28 Petronelli Way
- 92 Packard Way
