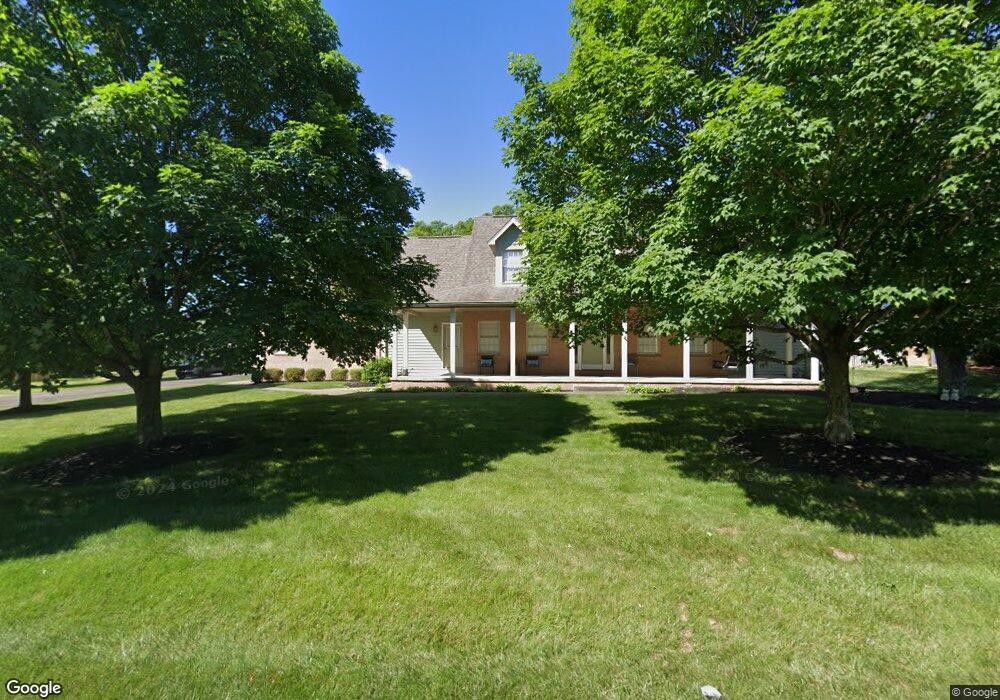
57 Yaples Orchard Dr Chillicothe, OH 45601
Estimated Value: $219,624 - $259,000
--
Bed
1
Bath
1,275
Sq Ft
$186/Sq Ft
Est. Value
About This Home
This home is located at 57 Yaples Orchard Dr, Chillicothe, OH 45601 and is currently estimated at $237,406, approximately $186 per square foot. 57 Yaples Orchard Dr is a home located in Ross County with nearby schools including Unioto Elementary School, Unioto Middle School, and Unioto High School.
Ownership History
Date
Name
Owned For
Owner Type
Purchase Details
Closed on
Oct 3, 2016
Sold by
Mallow Shelly M and Cox Dusty Lee
Bought by
Mallow Ii Steven M
Current Estimated Value
Home Financials for this Owner
Home Financials are based on the most recent Mortgage that was taken out on this home.
Original Mortgage
$117,826
Outstanding Balance
$94,400
Interest Rate
3.44%
Mortgage Type
FHA
Estimated Equity
$143,006
Purchase Details
Closed on
Mar 25, 2011
Sold by
Cartwright Barbara J
Bought by
Mallow Shelly M
Home Financials for this Owner
Home Financials are based on the most recent Mortgage that was taken out on this home.
Original Mortgage
$107,211
Interest Rate
5.04%
Mortgage Type
FHA
Purchase Details
Closed on
Jan 29, 2010
Sold by
Cartwright Charles H and Cartwright Barbara J
Bought by
Cartwright Barbara J
Purchase Details
Closed on
Jun 26, 2008
Sold by
Cartwright Charles H and Cartwright Barbara J
Bought by
Cartwright Charles H and Cartwright Barbara J
Create a Home Valuation Report for This Property
The Home Valuation Report is an in-depth analysis detailing your home's value as well as a comparison with similar homes in the area
Home Values in the Area
Average Home Value in this Area
Purchase History
| Date | Buyer | Sale Price | Title Company |
|---|---|---|---|
| Mallow Ii Steven M | $120,000 | Title First Agency Inc | |
| Mallow Shelly M | $110,000 | Arrow Title Agency Llc | |
| Cartwright Barbara J | -- | None Available | |
| Cartwright Charles H | -- | Attorney |
Source: Public Records
Mortgage History
| Date | Status | Borrower | Loan Amount |
|---|---|---|---|
| Open | Mallow Ii Steven M | $117,826 | |
| Previous Owner | Mallow Shelly M | $107,211 |
Source: Public Records
Tax History Compared to Growth
Tax History
| Year | Tax Paid | Tax Assessment Tax Assessment Total Assessment is a certain percentage of the fair market value that is determined by local assessors to be the total taxable value of land and additions on the property. | Land | Improvement |
|---|---|---|---|---|
| 2024 | $1,887 | $47,350 | $12,520 | $34,830 |
| 2023 | $1,887 | $47,350 | $12,520 | $34,830 |
| 2022 | $1,921 | $47,350 | $12,520 | $34,830 |
| 2021 | $1,794 | $38,760 | $10,430 | $28,330 |
| 2020 | $1,794 | $38,760 | $10,430 | $28,330 |
| 2019 | $1,795 | $38,760 | $10,430 | $28,330 |
| 2018 | $1,995 | $40,800 | $10,430 | $30,370 |
| 2017 | $2,147 | $40,800 | $10,430 | $30,370 |
| 2016 | $2,126 | $40,800 | $10,430 | $30,370 |
| 2015 | $1,990 | $37,300 | $10,430 | $26,870 |
| 2014 | $1,947 | $37,300 | $10,430 | $26,870 |
| 2013 | $1,949 | $37,300 | $10,430 | $26,870 |
Source: Public Records
Map
Nearby Homes
- 6 Mcintosh Ct
- 30 Fruit Hill Dr
- 88 Fruit Hill Dr
- 59 Limestone Blvd
- 7 Kensington Dr
- 5 Kensington Dr
- 9 Kensington Dr
- 15 Windsor Dr
- 14 Fruit Hill Dr
- 23 Shawnee Dr
- 2 Marlboro Dr
- 310 Almahurst Dr
- 662 Laurel St
- 14996 Pleasant Valley Rd Unit Lot 53
- 14996 Pleasant Valley Rd Unit Lot 60
- 14996 Pleasant Valley Rd Unit Lot 70
- 14996 Pleasant Valley Rd
- 625 Oneida Rd
- 44 Banyas Blvd
- 48 Banyas Blvd
- 57 Yaples Orchard Dr
- 61 Yaples Orchard Dr
- 51 Yaples Orchard Dr
- 65 Yaples Orchard Dr
- 53 Yaples Orchard Dr
- 55 Yaples Orchard Dr
- 73 Yaples Orchard Dr
- 49 Yaples Orchard Dr
- 58 Yaples Orchard Dr
- 62 Yaples Orchard Dr
- 69 Yaples Orchard Dr
- 69 Yaples Orchard Dr
- 69 Yaples Orchard Dr
- 66 Yaples Orchard Dr
- 46 Yaples Orchard Dr
- 50 Yaples Orchard Dr
- 70 Yaples Orchard Dr
- 45 Yaples Orchard Dr
- 113 Yaples Orchard Dr
- 224 Yaples Orchard Dr