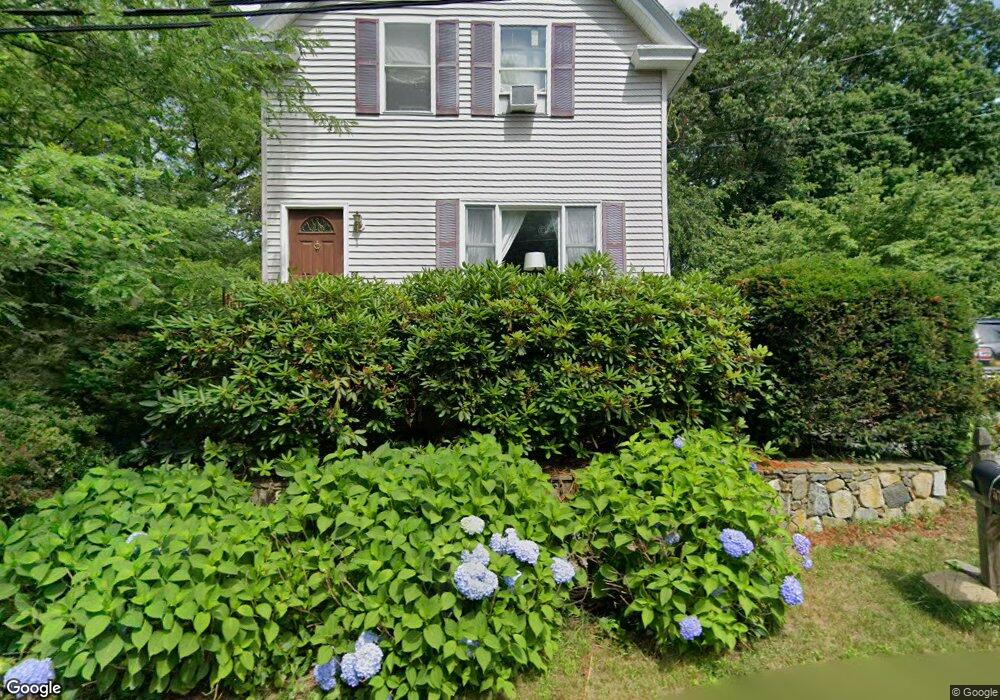
57 York St Dracut, MA 01826
Estimated Value: $517,000 - $561,000
3
Beds
2
Baths
1,315
Sq Ft
$406/Sq Ft
Est. Value
About This Home
This home is located at 57 York St, Dracut, MA 01826 and is currently estimated at $534,408, approximately $406 per square foot. 57 York St is a home located in Middlesex County with nearby schools including Joseph A. Campbell Elementary School, Richardson Middle School, and Dracut Senior High School.
Ownership History
Date
Name
Owned For
Owner Type
Purchase Details
Closed on
Aug 26, 2004
Sold by
New Line Homes Inc
Bought by
Santee Mark S and Langlois-Santee Susan
Current Estimated Value
Home Financials for this Owner
Home Financials are based on the most recent Mortgage that was taken out on this home.
Original Mortgage
$264,000
Outstanding Balance
$132,012
Interest Rate
6.02%
Mortgage Type
Purchase Money Mortgage
Estimated Equity
$402,396
Purchase Details
Closed on
Dec 17, 2002
Sold by
Boumil Brian J and Boumil Edward W
Bought by
New Line Homes Inc
Create a Home Valuation Report for This Property
The Home Valuation Report is an in-depth analysis detailing your home's value as well as a comparison with similar homes in the area
Home Values in the Area
Average Home Value in this Area
Purchase History
| Date | Buyer | Sale Price | Title Company |
|---|---|---|---|
| Santee Mark S | $330,000 | -- | |
| New Line Homes Inc | $106,000 | -- |
Source: Public Records
Mortgage History
| Date | Status | Borrower | Loan Amount |
|---|---|---|---|
| Open | Santee Mark S | $264,000 |
Source: Public Records
Tax History Compared to Growth
Tax History
| Year | Tax Paid | Tax Assessment Tax Assessment Total Assessment is a certain percentage of the fair market value that is determined by local assessors to be the total taxable value of land and additions on the property. | Land | Improvement |
|---|---|---|---|---|
| 2025 | $4,386 | $433,400 | $197,500 | $235,900 |
| 2024 | $4,712 | $450,900 | $188,100 | $262,800 |
| 2023 | $4,505 | $389,000 | $163,500 | $225,500 |
| 2022 | $4,487 | $365,100 | $148,600 | $216,500 |
| 2021 | $4,327 | $332,600 | $135,100 | $197,500 |
| 2020 | $10,184 | $324,800 | $131,100 | $193,700 |
| 2019 | $9,566 | $289,000 | $124,900 | $164,100 |
| 2018 | $6,678 | $276,300 | $124,900 | $151,400 |
| 2017 | $9,699 | $276,300 | $124,900 | $151,400 |
| 2016 | $3,576 | $241,000 | $120,000 | $121,000 |
| 2015 | $3,428 | $229,600 | $120,000 | $109,600 |
| 2014 | $3,217 | $222,000 | $120,000 | $102,000 |
Source: Public Records
Map
Nearby Homes
- 931 Methuen St Unit 6
- 820 Methuen St Unit 820
- 51 Bellevue Ave
- 14 Mount Pleasant Ave
- 173 Merrimack Meadows Ln Unit 162
- 821 Merrimack Ave
- 31 Varnum Ave
- 78 Merrimack Meadows Ln Unit 78
- 11 Merrimack Meadows Ln Unit 17
- 16 Winding Ln
- 16 Wetherbee Ave
- 15 Sharyn Cir
- 173 Brook St
- 2 Francis Dr Unit 412
- 4 Francis Dr Unit 105
- 2 Francis Dr Unit 213
- 4 Francis Dr Unit 207
- 100 Merrimack Ave Unit 91
- 100 Merrimack Ave Unit 124
- 4 Hazelwood Ave Unit 12