Estimated Value: $70,000 - $197,000
--
Bed
--
Bath
1,058
Sq Ft
$133/Sq Ft
Est. Value
About This Home
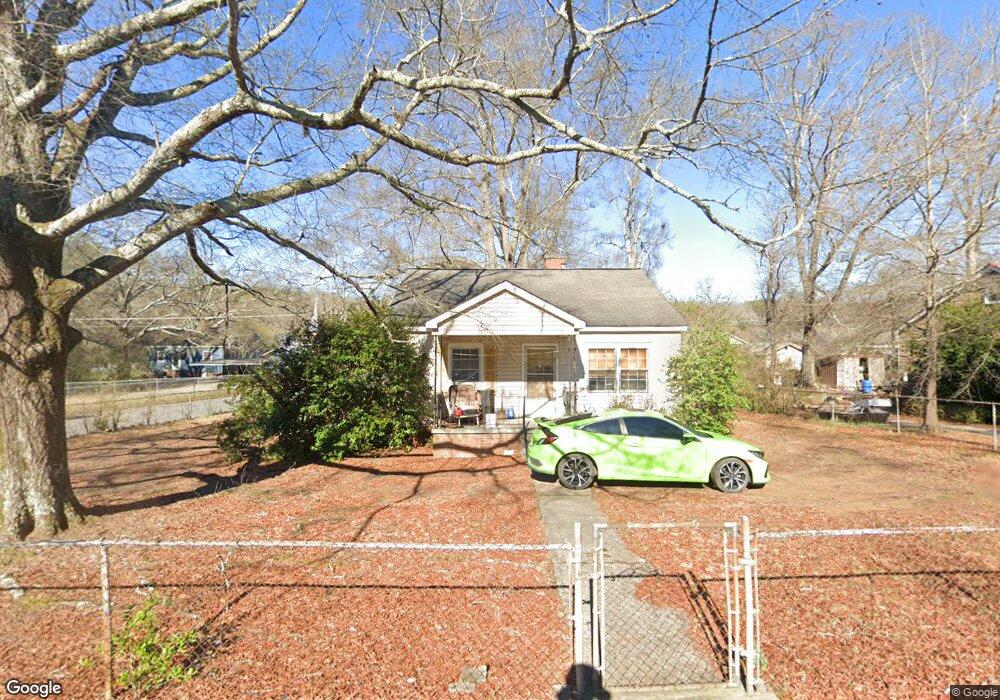
This home is located at 570 2nd St NE, Rome, GA 30161 and is currently estimated at $141,112, approximately $133 per square foot. 570 2nd St NE is a home located in Floyd County with nearby schools including Model Middle School and Model High School.
Ownership History
Date
Name
Owned For
Owner Type
Purchase Details
Closed on
Nov 1, 2022
Sold by
Village Rentals Inc
Bought by
Usa Residential Iii Llc
Current Estimated Value
Purchase Details
Closed on
Jun 27, 2018
Sold by
Broome Sandra
Bought by
Village Rentals Inc
Purchase Details
Closed on
Jun 20, 2013
Sold by
Arasmith Sandra L
Bought by
P and R
Purchase Details
Closed on
Aug 13, 2004
Sold by
Arasmith Stanley B
Bought by
Arasmith Sandra L
Purchase Details
Closed on
Apr 29, 2002
Sold by
Morris Burlene Hight and Annie Ruth Moore
Bought by
Arasmith Stanley B
Purchase Details
Closed on
Feb 4, 2001
Sold by
Hight Theodore J
Bought by
Morris Burlene Hight and Annie Ruth M
Purchase Details
Closed on
Mar 26, 1998
Sold by
Hight Theodore J
Bought by
Hight Theodore J
Purchase Details
Closed on
Mar 9, 1998
Sold by
Hight Theodore and Hight Shirley L
Bought by
Hight Theodore J
Purchase Details
Closed on
Jan 1, 1961
Bought by
Hight Theodore and Hight Shirley L
Create a Home Valuation Report for This Property
The Home Valuation Report is an in-depth analysis detailing your home's value as well as a comparison with similar homes in the area
Home Values in the Area
Average Home Value in this Area
Purchase History
| Date | Buyer | Sale Price | Title Company |
|---|---|---|---|
| Usa Residential Iii Llc | $1,320,167 | -- | |
| Village Rentals Inc | $35,000 | -- | |
| P | -- | -- | |
| Arasmith Sandra L | -- | -- | |
| Arasmith Stanley B | $50,000 | -- | |
| Morris Burlene Hight | -- | -- | |
| Hight Theodore J | -- | -- | |
| Hight Theodore J | -- | -- | |
| Hight Theodore | -- | -- |
Source: Public Records
Tax History Compared to Growth
Tax History
| Year | Tax Paid | Tax Assessment Tax Assessment Total Assessment is a certain percentage of the fair market value that is determined by local assessors to be the total taxable value of land and additions on the property. | Land | Improvement |
|---|---|---|---|---|
| 2024 | $1,150 | $36,227 | $7,219 | $29,008 |
| 2023 | $1,118 | $34,245 | $6,497 | $27,748 |
| 2022 | $619 | $18,070 | $5,414 | $12,656 |
| 2021 | $524 | $14,676 | $4,692 | $9,984 |
| 2020 | $480 | $13,256 | $3,610 | $9,646 |
| 2019 | $460 | $12,929 | $3,610 | $9,319 |
| 2018 | $465 | $13,165 | $3,610 | $9,555 |
| 2017 | $461 | $13,008 | $3,610 | $9,398 |
| 2016 | $505 | $14,240 | $3,600 | $10,640 |
| 2015 | $473 | $14,520 | $3,600 | $10,920 |
| 2014 | $473 | $14,520 | $3,600 | $10,920 |
Source: Public Records
Map
Nearby Homes
- 635 E 3rd St
- 535 1st St NE
- 841 Shannon Cir NE
- 430 Third St
- 4th Shannon Cir NE
- 320 Shannon Rd NE
- 255 E 2nd St NE
- 50 Round Rock Cir NE
- 814 Shannon Cir NE
- 59 Round Rock Cir NE
- 13 Granite Way NE
- 6 Keystone Ln NE
- 320 Old Shannon Rd NE
- 00 Todd St NE
- 56 Lull Rd NE
- 129 Pierce Hill Rd NE
- 1055 E Hermitage Rd NE
- 16 Cinnamon Ln NE
- 7 Thrushwood Rd NE
- 107 Winsome Place NE
- 570 2nd St NE
- 0 Shannon Cir NE Unit 8923730
- 0 Shannon Cir NE Unit 6 8881206
- 0 Shannon Cir NE Unit 5 8881200
- 0 Shannon Cir NE Unit 8 8881197
- 0 Shannon Cir NE Unit 3 8881186
- 0 Shannon Cir NE Unit 2 8881182
- 0 Shannon Cir NE Unit 1 8881174
- 0 Shannon Cir NE Unit Tr 14 8473277
- 560 2nd St NE
- 600 2nd St NE
- 575 E 3rd St
- 550 2nd St NE
- 465 E 2nd St
- 465 2nd - Shannon St
- 465 Second St
- 565 3rd
- 565 Third St
- 565 3rd - Shannon St
- 3rd St