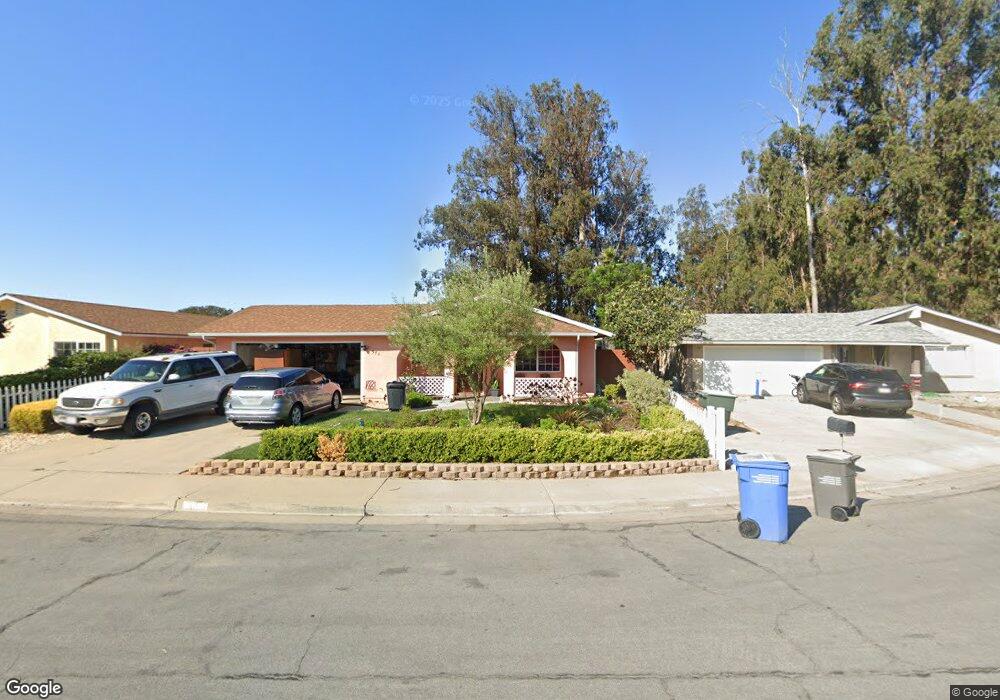
570 Belanger Dr Nipomo, CA 93444
Estimated Value: $600,000 - $648,000
3
Beds
2
Baths
1,100
Sq Ft
$566/Sq Ft
Est. Value
About This Home
This home is located at 570 Belanger Dr, Nipomo, CA 93444 and is currently estimated at $622,264, approximately $565 per square foot. 570 Belanger Dr is a home located in San Luis Obispo County with nearby schools including Dorothea Lange Elementary School, Mesa Middle School, and Nipomo High School.
Ownership History
Date
Name
Owned For
Owner Type
Purchase Details
Closed on
Feb 4, 2013
Sold by
Ponce Pedro
Bought by
Ponce Pedro and Guerrero Rosa Delia
Current Estimated Value
Home Financials for this Owner
Home Financials are based on the most recent Mortgage that was taken out on this home.
Original Mortgage
$215,185
Outstanding Balance
$150,078
Interest Rate
3.36%
Mortgage Type
New Conventional
Estimated Equity
$472,186
Purchase Details
Closed on
Mar 15, 2002
Sold by
Mallory Harvey Alan and Mallory Tonia
Bought by
Ponce Pedro
Home Financials for this Owner
Home Financials are based on the most recent Mortgage that was taken out on this home.
Original Mortgage
$224,477
Interest Rate
6.87%
Mortgage Type
FHA
Purchase Details
Closed on
Feb 20, 1998
Sold by
Beneficial California Inc
Bought by
Mallory Harvey Alan and Mallory Tonia
Home Financials for this Owner
Home Financials are based on the most recent Mortgage that was taken out on this home.
Original Mortgage
$109,299
Interest Rate
7.07%
Mortgage Type
FHA
Purchase Details
Closed on
Sep 19, 1997
Sold by
Aguirre Noe L and Aguirre Leticia O
Bought by
Beneficial California Inc
Create a Home Valuation Report for This Property
The Home Valuation Report is an in-depth analysis detailing your home's value as well as a comparison with similar homes in the area
Home Values in the Area
Average Home Value in this Area
Purchase History
| Date | Buyer | Sale Price | Title Company |
|---|---|---|---|
| Ponce Pedro | -- | Fidelity National Title Co | |
| Ponce Pedro | $228,000 | Fidelity Title Company | |
| Mallory Harvey Alan | $110,000 | Chicago Title Co | |
| Beneficial California Inc | $123,248 | Chicago Title |
Source: Public Records
Mortgage History
| Date | Status | Borrower | Loan Amount |
|---|---|---|---|
| Open | Ponce Pedro | $215,185 | |
| Closed | Ponce Pedro | $224,477 | |
| Previous Owner | Mallory Harvey Alan | $109,299 |
Source: Public Records
Tax History
| Year | Tax Paid | Tax Assessment Tax Assessment Total Assessment is a certain percentage of the fair market value that is determined by local assessors to be the total taxable value of land and additions on the property. | Land | Improvement |
|---|---|---|---|---|
| 2025 | $3,391 | $336,802 | $147,720 | $189,082 |
| 2024 | $3,351 | $330,199 | $144,824 | $185,375 |
| 2023 | $3,351 | $323,726 | $141,985 | $181,741 |
| 2022 | $3,299 | $317,379 | $139,201 | $178,178 |
| 2021 | $3,291 | $311,157 | $136,472 | $174,685 |
| 2020 | $3,253 | $307,967 | $135,073 | $172,894 |
| 2019 | $3,231 | $301,929 | $132,425 | $169,504 |
| 2018 | $3,191 | $296,010 | $129,829 | $166,181 |
| 2017 | $3,130 | $290,207 | $127,284 | $162,923 |
| 2016 | $2,951 | $284,518 | $124,789 | $159,729 |
| 2015 | $2,907 | $280,245 | $122,915 | $157,330 |
| 2014 | $2,798 | $274,757 | $120,508 | $154,249 |
Source: Public Records
Map
Nearby Homes
- 689 Phoebe St
- 640 Honey Grove Ln
- 450 Avenida de Socios Unit 5
- 483 Violet Ave
- 368 Avenida de Amigos
- 571 S Oakglen Ave
- 567 S Oakglen Ave
- 565 S Oakglen Ave
- 424 Bermuda Place
- 522 Higos Way
- 525 Grande Ave Unit D
- 840 S Oak Glen Ave
- 345 Black Hawk Way
- 325 Black Hawk Way
- 945 Jeanette Ln
- 680 Hill St
- 449 W Tefft St
- 449 W Tefft St Unit 23
- 449 W Tefft St Unit 22
- 449 W Tefft St Unit 13
- 566 Belanger Dr
- 574 Belanger Dr
- 562 Belanger Dr
- 578 Belanger Dr
- 573 Belanger Dr
- 582 Belanger Dr
- 569 Belanger Dr
- 565 Belanger Dr
- 575 Meredith Ave
- 581 Belanger Dr
- 586 Belanger Dr
- 581 Meredith Ave
- 585 Belanger Dr
- 561 Meredith Ave
- 590 Belanger Dr
- 585 Meredith Ave
- 593 Belanger Dr
- 594 Belanger Dr
- 540 Avenida Montecito Verde
Your Personal Tour Guide
Ask me questions while you tour the home.