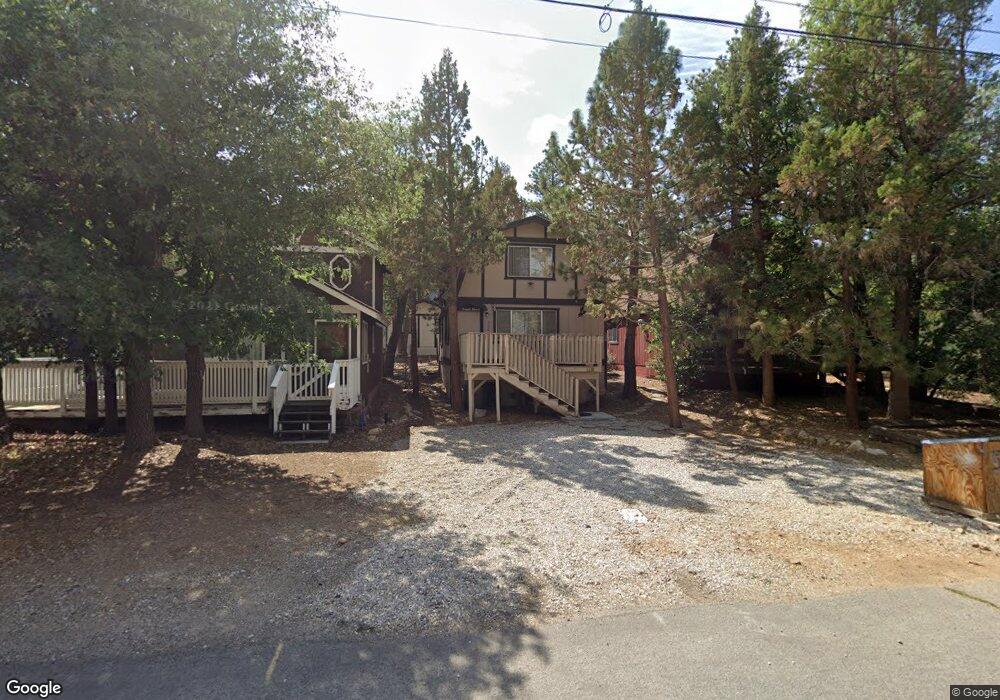
570 Maple Ln Sugarloaf, CA 92386
Estimated Value: $234,000 - $295,000
2
Beds
2
Baths
1,020
Sq Ft
$257/Sq Ft
Est. Value
About This Home
This home is located at 570 Maple Ln, Sugarloaf, CA 92386 and is currently estimated at $261,700, approximately $256 per square foot. 570 Maple Ln is a home located in San Bernardino County with nearby schools including Baldwin Lane Elementary School, Big Bear Middle School, and Big Bear High School.
Ownership History
Date
Name
Owned For
Owner Type
Purchase Details
Closed on
Aug 21, 2013
Sold by
Allen Cheri
Bought by
Allen Roland
Current Estimated Value
Home Financials for this Owner
Home Financials are based on the most recent Mortgage that was taken out on this home.
Original Mortgage
$74,400
Outstanding Balance
$55,593
Interest Rate
4.51%
Mortgage Type
Seller Take Back
Estimated Equity
$206,107
Purchase Details
Closed on
Jul 13, 2001
Sold by
Guentherman Larry
Bought by
Guentherman Larry and Guentherman Pauline
Create a Home Valuation Report for This Property
The Home Valuation Report is an in-depth analysis detailing your home's value as well as a comparison with similar homes in the area
Home Values in the Area
Average Home Value in this Area
Purchase History
| Date | Buyer | Sale Price | Title Company |
|---|---|---|---|
| Allen Roland | -- | Chicago Title | |
| Allen Roland | $93,000 | Chicago Title | |
| Guentherman Larry | -- | -- |
Source: Public Records
Mortgage History
| Date | Status | Borrower | Loan Amount |
|---|---|---|---|
| Open | Allen Roland | $74,400 |
Source: Public Records
Tax History
| Year | Tax Paid | Tax Assessment Tax Assessment Total Assessment is a certain percentage of the fair market value that is determined by local assessors to be the total taxable value of land and additions on the property. | Land | Improvement |
|---|---|---|---|---|
| 2025 | $2,575 | $114,005 | $22,801 | $91,204 |
| 2024 | $2,448 | $111,770 | $22,354 | $89,416 |
| 2023 | $2,354 | $109,579 | $21,916 | $87,663 |
| 2022 | $2,249 | $107,430 | $21,486 | $85,944 |
| 2021 | $2,194 | $105,324 | $21,065 | $84,259 |
| 2020 | $2,178 | $104,244 | $20,849 | $83,395 |
| 2019 | $2,127 | $102,200 | $20,440 | $81,760 |
| 2018 | $2,045 | $100,196 | $20,039 | $80,157 |
| 2017 | $1,984 | $98,231 | $19,646 | $78,585 |
| 2016 | $1,932 | $96,305 | $19,261 | $77,044 |
| 2015 | $1,896 | $94,859 | $18,972 | $75,887 |
| 2014 | $1,858 | $93,000 | $18,600 | $74,400 |
Source: Public Records
Map
Nearby Homes
- 854 Cedar Ln
- 478 Cedar Ln
- 548 Moreno Ln
- 497 Cedar Ln
- 0 Spruce Ln Unit 32501909
- 0 Spruce Ln Unit IG25167820
- 0 Spruce Ln Unit IG25167795
- 573 Spruce Ln
- 581 Highland Ln
- 630 Victoria Ln
- 0 San Bernardino Ave Unit IG25277274
- 0 San Bernardino Ave Unit 32502826
- 303 Los Angeles
- 0 San Bernardino Ave Unit 32502825
- 0 San Bernardino Ave Unit IG25277280
- 44667 Barton Ln
- 428 Maple Ln
- 560 Highland Ln
- 568 Highland Ln
- 564 Highland Ln
Your Personal Tour Guide
Ask me questions while you tour the home.