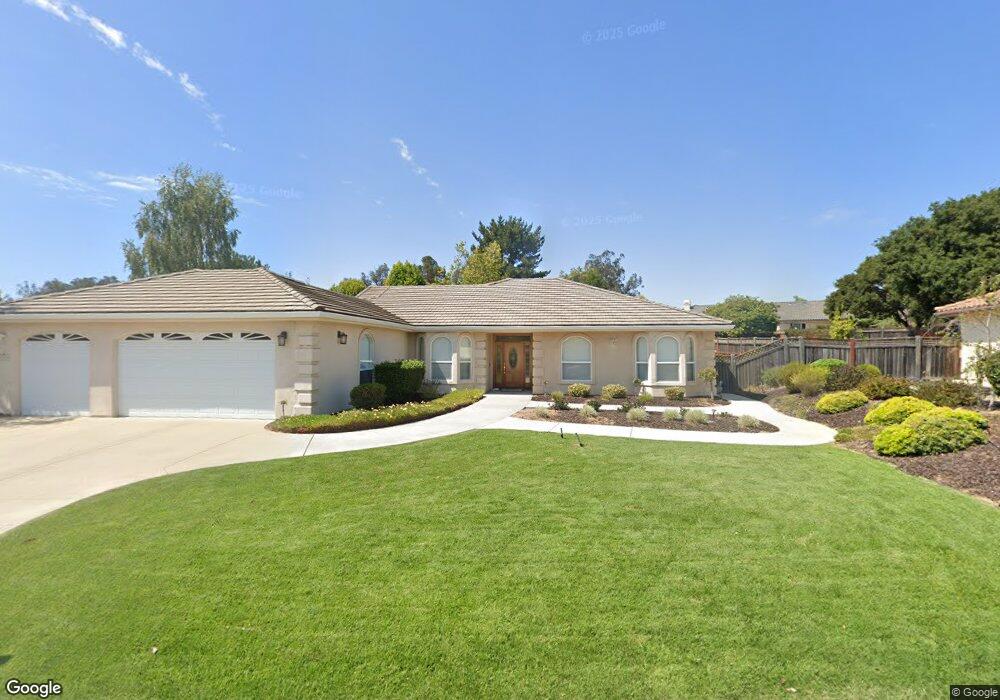
570 Tejas Place Nipomo, CA 93444
Estimated Value: $1,043,000 - $1,316,000
3
Beds
2
Baths
2,257
Sq Ft
$512/Sq Ft
Est. Value
About This Home
This home is located at 570 Tejas Place, Nipomo, CA 93444 and is currently estimated at $1,156,087, approximately $512 per square foot. 570 Tejas Place is a home located in San Luis Obispo County with nearby schools including Dana Elementary School, Mesa Middle School, and Nipomo High School.
Ownership History
Date
Name
Owned For
Owner Type
Purchase Details
Closed on
Oct 31, 2006
Sold by
Minor David E and Minor Juanita L
Bought by
Minor David E and Minor Juanita L
Current Estimated Value
Home Financials for this Owner
Home Financials are based on the most recent Mortgage that was taken out on this home.
Original Mortgage
$25,000
Outstanding Balance
$14,709
Interest Rate
6.3%
Mortgage Type
Credit Line Revolving
Estimated Equity
$1,141,378
Purchase Details
Closed on
Jun 12, 2003
Sold by
Minor David E and Minor Juanita L
Bought by
Minor David E and Minor Juanita L
Purchase Details
Closed on
Oct 25, 2001
Sold by
Nester Greg
Bought by
Minor David E and Minor Juanita L
Home Financials for this Owner
Home Financials are based on the most recent Mortgage that was taken out on this home.
Original Mortgage
$344,925
Interest Rate
6.63%
Create a Home Valuation Report for This Property
The Home Valuation Report is an in-depth analysis detailing your home's value as well as a comparison with similar homes in the area
Home Values in the Area
Average Home Value in this Area
Purchase History
| Date | Buyer | Sale Price | Title Company |
|---|---|---|---|
| Minor David E | -- | Chicago Title Co | |
| Minor David E | -- | Chicago Title Co | |
| Minor David E | -- | -- | |
| Minor David E | $460,000 | First American Title |
Source: Public Records
Mortgage History
| Date | Status | Borrower | Loan Amount |
|---|---|---|---|
| Open | Minor David E | $25,000 | |
| Open | Minor David E | $485,000 | |
| Closed | Minor David E | $344,925 |
Source: Public Records
Tax History Compared to Growth
Tax History
| Year | Tax Paid | Tax Assessment Tax Assessment Total Assessment is a certain percentage of the fair market value that is determined by local assessors to be the total taxable value of land and additions on the property. | Land | Improvement |
|---|---|---|---|---|
| 2025 | $6,927 | $678,799 | $236,355 | $442,444 |
| 2024 | $6,846 | $665,490 | $231,721 | $433,769 |
| 2023 | $6,846 | $652,442 | $227,178 | $425,264 |
| 2022 | $6,741 | $639,650 | $222,724 | $416,926 |
| 2021 | $6,728 | $627,108 | $218,357 | $408,751 |
| 2020 | $6,650 | $620,679 | $216,119 | $404,560 |
| 2019 | $6,608 | $608,510 | $211,882 | $396,628 |
| 2018 | $6,528 | $596,579 | $207,728 | $388,851 |
| 2017 | $6,405 | $584,882 | $203,655 | $381,227 |
| 2016 | $6,040 | $573,414 | $199,662 | $373,752 |
| 2015 | $5,953 | $564,801 | $196,663 | $368,138 |
| 2014 | $5,731 | $553,738 | $192,811 | $360,927 |
Source: Public Records
Map
Nearby Homes
- 615 Sweet Donna Place
- 7855 Suey Creek Rd
- 620 Camino Roble
- 1010 1012 Upper Los Berros Rd
- 875 Camino Caballo
- 219 Lema Dr
- 217 Hope Way
- 231 Trevino Dr
- 261 Hazel Ln
- 759 Viola Ct
- 228 Chaparral Ln
- 940 Calle Fresa
- 255 Encino Ln
- 161 Lot Scenic View Way
- 0 Scenic View Way
- 719 W Tefft St
- 393 Uranus Ct
- 1431 La Loma Dr
- 1180 Starlite Dr
- 1127 Starlite Dr