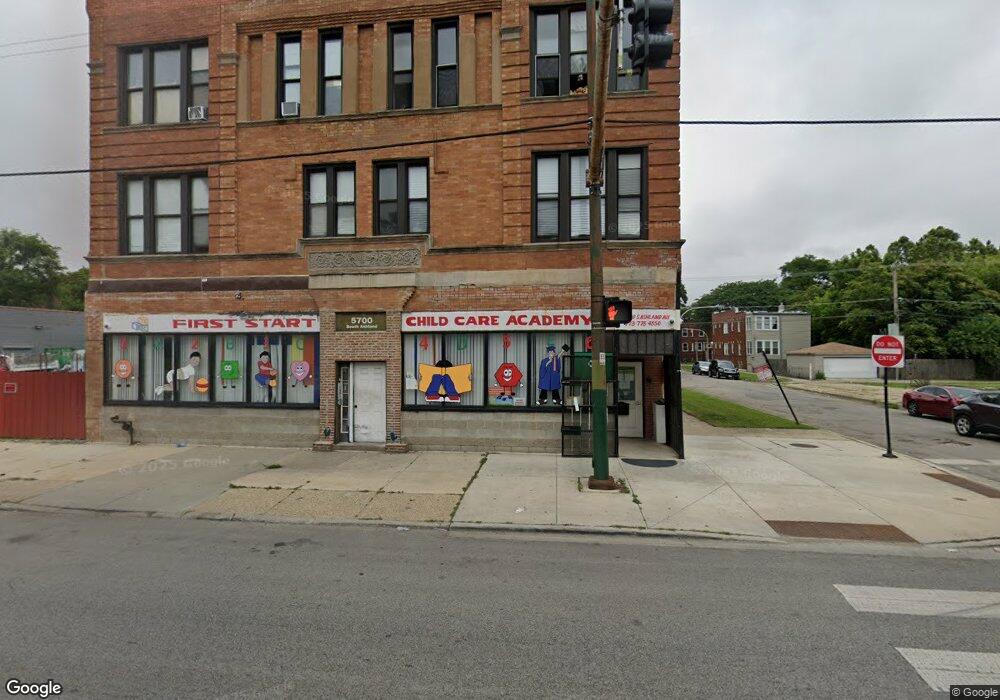
5700 S Ashland Ave Unit 2NF Chicago, IL 60636
Englewood NeighborhoodEstimated Value: $457,233
3
Beds
2
Baths
850
Sq Ft
$538/Sq Ft
Est. Value
About This Home
This home is located at 5700 S Ashland Ave Unit 2NF, Chicago, IL 60636 and is currently estimated at $457,233, approximately $537 per square foot. 5700 S Ashland Ave Unit 2NF is a home located in Cook County with nearby schools including A. Langford Elementary School.
Ownership History
Date
Name
Owned For
Owner Type
Purchase Details
Closed on
Jul 17, 2017
Sold by
Equity Investments & Venture Group Llc
Bought by
Jovic Miodrag
Current Estimated Value
Purchase Details
Closed on
Dec 24, 2014
Sold by
Jovanovic Petar and Cemerikic Srdjan
Bought by
Equity Investment & Venture Group Llc
Purchase Details
Closed on
Apr 19, 2005
Sold by
Husein Eman
Bought by
Cemerikic Srdjan and Jovanovic Petar
Home Financials for this Owner
Home Financials are based on the most recent Mortgage that was taken out on this home.
Original Mortgage
$540,000
Interest Rate
5.75%
Mortgage Type
Construction
Purchase Details
Closed on
Apr 25, 2003
Sold by
Husein Hafez
Bought by
Husein Eman
Purchase Details
Closed on
Oct 22, 1998
Sold by
Shalabi Sulieman
Bought by
Husein Hafez
Create a Home Valuation Report for This Property
The Home Valuation Report is an in-depth analysis detailing your home's value as well as a comparison with similar homes in the area
Home Values in the Area
Average Home Value in this Area
Purchase History
| Date | Buyer | Sale Price | Title Company |
|---|---|---|---|
| Jovic Miodrag | $300,000 | Wfg National Title Insurane | |
| Equity Investment & Venture Group Llc | -- | None Available | |
| Cemerikic Srdjan | $220,000 | Multiple | |
| Husein Eman | -- | -- | |
| Husein Hafez | $7,000 | -- |
Source: Public Records
Mortgage History
| Date | Status | Borrower | Loan Amount |
|---|---|---|---|
| Previous Owner | Cemerikic Srdjan | $540,000 |
Source: Public Records
Tax History Compared to Growth
Tax History
| Year | Tax Paid | Tax Assessment Tax Assessment Total Assessment is a certain percentage of the fair market value that is determined by local assessors to be the total taxable value of land and additions on the property. | Land | Improvement |
|---|---|---|---|---|
| 2024 | $14,060 | $76,346 | $4,995 | $71,351 |
| 2023 | $13,629 | $58,562 | $4,995 | $53,567 |
| 2022 | $13,629 | $58,562 | $4,995 | $53,567 |
| 2021 | $11,776 | $58,561 | $4,995 | $53,566 |
| 2020 | $9,318 | $41,828 | $4,995 | $36,833 |
| 2019 | $8,404 | $41,828 | $4,995 | $36,833 |
| 2018 | $8,262 | $41,828 | $4,995 | $36,833 |
| 2017 | $8,289 | $38,507 | $4,578 | $33,929 |
| 2016 | $7,713 | $38,507 | $4,578 | $33,929 |
| 2015 | $7,056 | $38,507 | $4,578 | $33,929 |
| 2014 | $7,145 | $38,507 | $4,578 | $33,929 |
| 2013 | $7,003 | $38,507 | $4,578 | $33,929 |
Source: Public Records
Map
Nearby Homes
- 5656 S Marshfield Ave
- 5734 S Ashland Ave
- 5742 S Marshfield Ave
- 5633 S Justine St
- 5720 S Paulina St
- 5605 S Justine St
- 5750 S Paulina St
- 5538 S Ashland Ave
- 5748 S Laflin St
- 5752 S Paulina St
- 5711 S Laflin St
- 5812 S Marshfield Ave
- 5617 S Laflin St
- 5658 S Hermitage Ave
- 5517 S Justine St
- 5708 S Loomis Blvd
- 5642 S Loomis Blvd
- 1453 W Garfield Blvd Unit 2
- 1453 W Garfield Blvd Unit 1
- 1510 W Garfield Blvd
- 5700 S Ashland Ave
- 5700 S Ashland Ave Unit 3NR
- 5700 S Ashland Ave Unit 2NR
- 5700 S Ashland Ave Unit 3NF
- 5702 S Ashland Ave
- 5702 S Ashland Ave Unit 2SR
- 5702 S Ashland Ave Unit 3SR
- 5702 S Ashland Ave Unit 2SF
- 5702 S Ashland Ave Unit 3SF
- 5706 S Ashland Ave
- 5703 S Marshfield Ave
- 5724 S Ashland Ave
- 5652 S Ashland Ave
- 5701 S Marshfield Ave
- 5701 S Marshfield Ave
- 5701 S Marshfield Ave Unit 2
- 5657 S Marshfield Ave Unit 59
- 5659 S Marshfield Ave
- 5659 S Marshfield Ave
- 5711 S Marshfield Ave