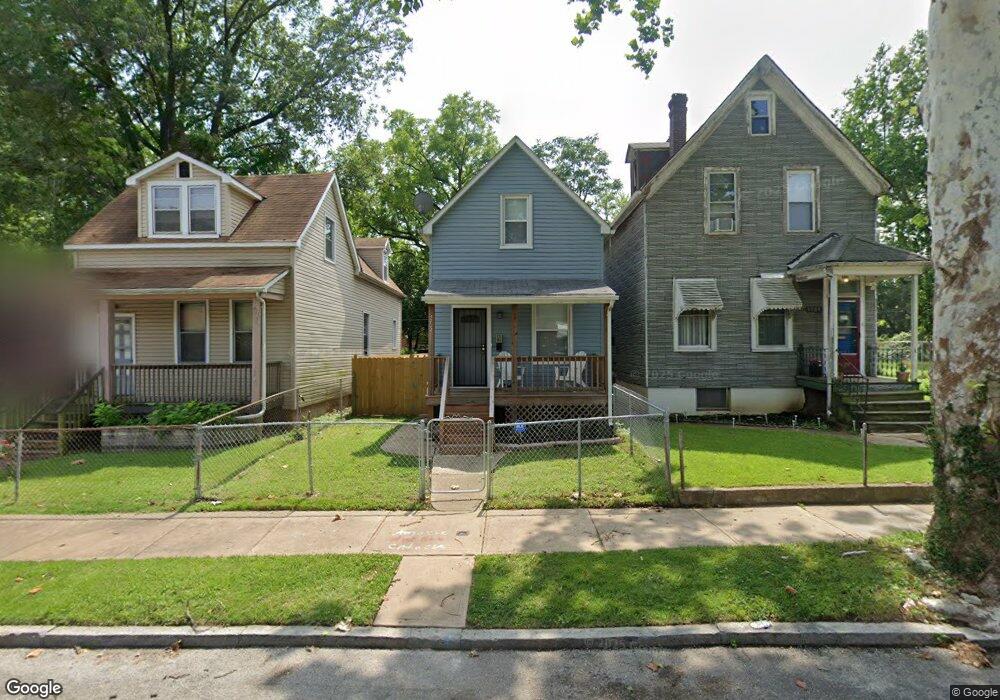
5702 Highland Ave Saint Louis, MO 63112
Wells-Goodfellow NeighborhoodEstimated Value: $38,451 - $62,000
--
Bed
1
Bath
1,476
Sq Ft
$34/Sq Ft
Est. Value
About This Home
This home is located at 5702 Highland Ave, Saint Louis, MO 63112 and is currently estimated at $50,363, approximately $34 per square foot. 5702 Highland Ave is a home located in St. Louis City with nearby schools including Laclede Elementary School, Sumner High School, and North Side Community Elementary School.
Ownership History
Date
Name
Owned For
Owner Type
Purchase Details
Closed on
Jan 31, 2020
Sold by
Land Reutilization Authority Of The City
Bought by
Conrod Tony
Current Estimated Value
Purchase Details
Closed on
Jan 23, 2015
Sold by
Adams Georgia
Bought by
Simms Roslyn
Purchase Details
Closed on
Oct 12, 1999
Sold by
D Adams Georgia Clar and D Adams Will
Bought by
Adams William and Adams Georgia
Home Financials for this Owner
Home Financials are based on the most recent Mortgage that was taken out on this home.
Original Mortgage
$42,300
Interest Rate
10.62%
Mortgage Type
Purchase Money Mortgage
Purchase Details
Closed on
Jan 6, 1997
Sold by
Adams Georgia C and Green Georgia Clarita
Bought by
Adams William D and Adams Georgia Clareta Green
Home Financials for this Owner
Home Financials are based on the most recent Mortgage that was taken out on this home.
Original Mortgage
$33,600
Interest Rate
7.14%
Mortgage Type
Purchase Money Mortgage
Create a Home Valuation Report for This Property
The Home Valuation Report is an in-depth analysis detailing your home's value as well as a comparison with similar homes in the area
Home Values in the Area
Average Home Value in this Area
Purchase History
| Date | Buyer | Sale Price | Title Company |
|---|---|---|---|
| Conrod Tony | $2,505 | None Available | |
| Simms Roslyn | -- | None Available | |
| Adams William | -- | -- | |
| Adams William D | -- | -- |
Source: Public Records
Mortgage History
| Date | Status | Borrower | Loan Amount |
|---|---|---|---|
| Previous Owner | Adams William | $42,300 | |
| Previous Owner | Adams William D | $33,600 |
Source: Public Records
Tax History Compared to Growth
Tax History
| Year | Tax Paid | Tax Assessment Tax Assessment Total Assessment is a certain percentage of the fair market value that is determined by local assessors to be the total taxable value of land and additions on the property. | Land | Improvement |
|---|---|---|---|---|
| 2025 | $164 | $1,680 | $150 | $1,530 |
| 2024 | $157 | $1,620 | $150 | $1,470 |
| 2023 | $157 | $1,620 | $150 | $1,470 |
| 2022 | $159 | $1,590 | $150 | $1,440 |
| 2021 | $159 | $1,590 | $150 | $1,440 |
| 2020 | $28 | $1,590 | $150 | $1,440 |
| 2019 | $159 | $1,590 | $150 | $1,440 |
| 2018 | $156 | $1,520 | $150 | $1,370 |
| 2017 | $154 | $1,520 | $150 | $1,370 |
| 2016 | $170 | $1,690 | $320 | $1,370 |
| 2015 | $156 | $1,690 | $320 | $1,370 |
| 2014 | $187 | $1,690 | $320 | $1,370 |
| 2013 | -- | $2,090 | $320 | $1,770 |
Source: Public Records
Map
Nearby Homes
- 5651 Highland Ave
- 5662 Maffitt Ave
- 5658 Maffitt Ave
- 2742 Goodfellow Blvd
- 2752 Goodfellow Blvd
- 5875 Lotus Ave
- 5710 Saint Louis Ave
- 5895 Highland Ave
- 5809 Doctor Martin Luther King Dr
- 5723 Labadie Ave
- 1960 Semple Ave
- 1630 Semple Ave
- 5379 Wabada Ave
- 1916 Arlington Ave
- 2810 Arlington Ave
- 1412 Rowan Ave
- 1387 Temple Place
- 2843 Abner Place
- 5923 Ridge Ave
- 5934 Ridge Ave
- 5700 Highland Ave
- 5704 Highland Ave
- 5658 Highland Ave
- 5656 Highland Ave
- 5705 Wabada Ave
- 5707 Wabada Ave
- 5718 Highland Ave
- 5657 Wabada Ave
- 5703 Highland Ave
- 5707 Highland Ave
- 5659 Highland Ave
- 5720 Highland Ave
- 5653 Wabada Ave
- 5657 Highland Ave
- 5651 Wabada Ave
- 5655 Highland Ave
- 5723 Wabada Ave
- 5719 Highland Ave
- 5725 Wabada Ave
- 564345 Highland Ave