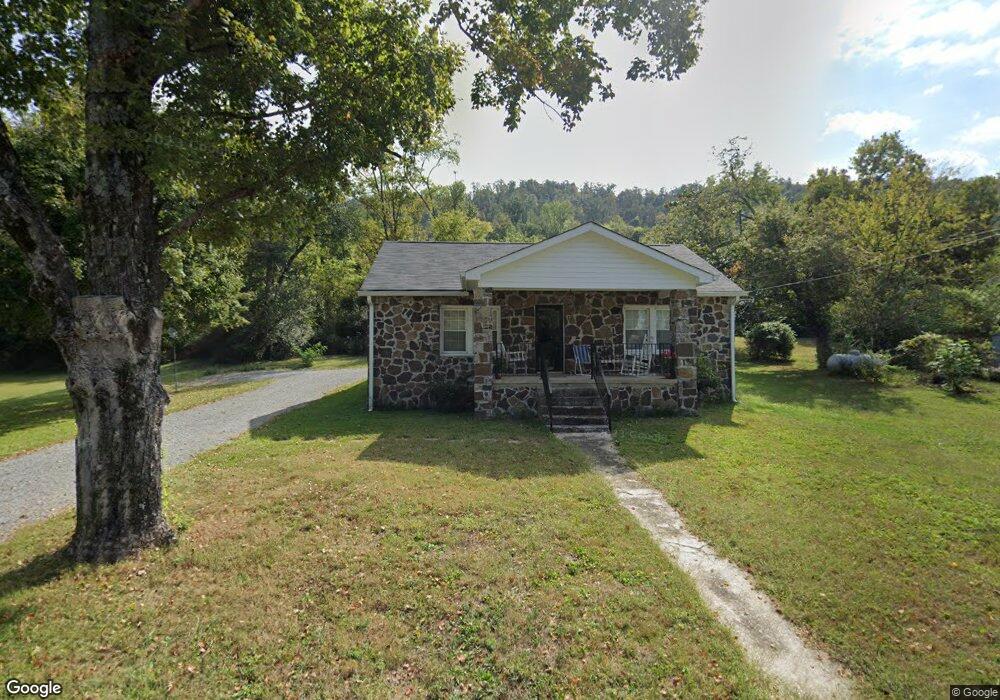
5706 Whittenberg St Ooltewah, TN 37363
Ooltewah Center NeighborhoodEstimated Value: $222,479 - $284,000
2
Beds
1
Bath
1,184
Sq Ft
$212/Sq Ft
Est. Value
About This Home
This home is located at 5706 Whittenberg St, Ooltewah, TN 37363 and is currently estimated at $251,370, approximately $212 per square foot. 5706 Whittenberg St is a home located in Hamilton County with nearby schools including Ooltewah Elementary School, Ooltewah Middle School, and Ooltewah High School.
Ownership History
Date
Name
Owned For
Owner Type
Purchase Details
Closed on
Aug 13, 2008
Sold by
Torsney Mark
Bought by
Tweedie Michael J
Current Estimated Value
Home Financials for this Owner
Home Financials are based on the most recent Mortgage that was taken out on this home.
Original Mortgage
$98,718
Outstanding Balance
$64,728
Interest Rate
6.31%
Mortgage Type
FHA
Estimated Equity
$186,642
Purchase Details
Closed on
May 26, 2006
Sold by
Jenkins John M
Bought by
Torsney Mark
Home Financials for this Owner
Home Financials are based on the most recent Mortgage that was taken out on this home.
Original Mortgage
$78,000
Interest Rate
7.25%
Mortgage Type
Purchase Money Mortgage
Purchase Details
Closed on
Nov 8, 2002
Sold by
Guffey Patricia A
Bought by
Jenkins John M
Purchase Details
Closed on
Dec 8, 1997
Sold by
Bullington Carolyn Benneth and Bennett Carolyn
Bought by
Jenkins John M and Guffey Patricia A
Home Financials for this Owner
Home Financials are based on the most recent Mortgage that was taken out on this home.
Original Mortgage
$60,634
Interest Rate
7.19%
Mortgage Type
FHA
Create a Home Valuation Report for This Property
The Home Valuation Report is an in-depth analysis detailing your home's value as well as a comparison with similar homes in the area
Home Values in the Area
Average Home Value in this Area
Purchase History
| Date | Buyer | Sale Price | Title Company |
|---|---|---|---|
| Tweedie Michael J | $103,500 | Cumberland Title & Guaranty | |
| Torsney Mark | $97,500 | None Available | |
| Jenkins John M | -- | First Choice Title Inc | |
| Jenkins John M | $61,500 | -- |
Source: Public Records
Mortgage History
| Date | Status | Borrower | Loan Amount |
|---|---|---|---|
| Open | Tweedie Michael J | $98,718 | |
| Previous Owner | Torsney Mark | $78,000 | |
| Previous Owner | Jenkins John M | $60,634 |
Source: Public Records
Tax History Compared to Growth
Tax History
| Year | Tax Paid | Tax Assessment Tax Assessment Total Assessment is a certain percentage of the fair market value that is determined by local assessors to be the total taxable value of land and additions on the property. | Land | Improvement |
|---|---|---|---|---|
| 2024 | $574 | $25,675 | $0 | $0 |
| 2023 | $583 | $25,675 | $0 | $0 |
| 2022 | $583 | $25,675 | $0 | $0 |
| 2021 | $583 | $25,675 | $0 | $0 |
| 2020 | $513 | $27,200 | $0 | $0 |
| 2019 | $761 | $27,200 | $0 | $0 |
| 2018 | $761 | $27,200 | $0 | $0 |
| 2017 | $761 | $27,200 | $0 | $0 |
| 2016 | $711 | $0 | $0 | $0 |
| 2015 | $711 | $25,375 | $0 | $0 |
| 2014 | $711 | $0 | $0 | $0 |
Source: Public Records
Map
Nearby Homes
- 5662 Mountain Oaks Ln
- 5603 Mountain Oaks Ln
- 8828 Meadowvale Ct
- 8829 Meadowvale Ct
- 8825 Meadowvale Ct
- 0 Main St
- 5609 Watkins St
- 5515 Main St
- 5614 Jonquil Ln
- 9655 Hosta Ln
- 9467 Cavalier Way
- 9461 Cavalier Way
- 9455 Cavalier Way
- 94755 Cavalier Way
- 9449 Cavalier Way
- The Oxford Plan at Dogwood Estates
- The Ellison II Plan at Dogwood Estates
- The Norwood II Plan at Dogwood Estates
- The Maddux II Plan at Dogwood Estates
- 9437 Cavalier Way
- 5710 Whittenberg St
- 9613 Vine St
- 9615 Vine St
- 5712 Whittenberg St
- 9608 W Cherry St
- 9617 Vine St
- 9607 Vine St
- 9621 Vine St
- 9614 Vine St
- 9625 Vine St
- 9625 Vine St Unit 3
- 9625 Vine St Unit 1
- 5714 Whittenberg St
- 9610 Vine St
- 9618 Vine St
- 9608 Vine St
- 5715 Whittenberg St
- 9620 Vine St Unit 1
- 5720 Cherry St
- 9603 Vine St