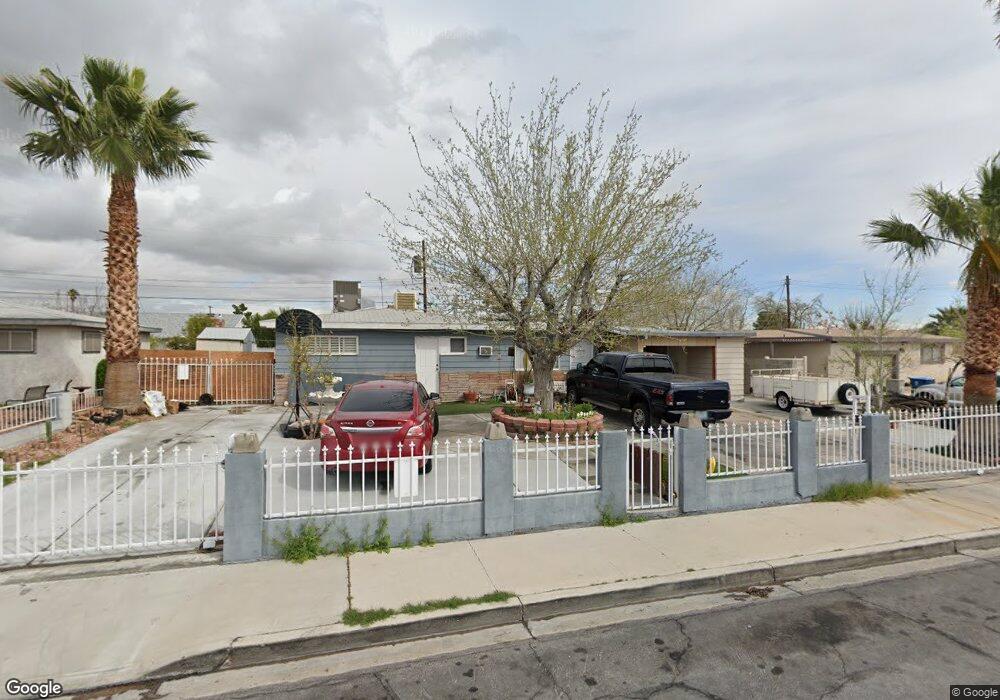
5708 Idle Ave Las Vegas, NV 89107
Buffalo NeighborhoodEstimated Value: $345,000 - $377,000
4
Beds
2
Baths
1,528
Sq Ft
$236/Sq Ft
Est. Value
About This Home
This home is located at 5708 Idle Ave, Las Vegas, NV 89107 and is currently estimated at $360,132, approximately $235 per square foot. 5708 Idle Ave is a home located in Clark County with nearby schools including Red Rock Elementary School, Frank F Garside Junior High School, and Western High School.
Ownership History
Date
Name
Owned For
Owner Type
Purchase Details
Closed on
Feb 11, 2007
Sold by
Knapp James N and Knapp Susan E
Bought by
Marquez Francisco J
Current Estimated Value
Home Financials for this Owner
Home Financials are based on the most recent Mortgage that was taken out on this home.
Original Mortgage
$180,000
Outstanding Balance
$116,286
Interest Rate
7.62%
Mortgage Type
Balloon
Estimated Equity
$243,846
Purchase Details
Closed on
Oct 29, 2001
Sold by
Rafique Saima and Rafique Sumaira
Bought by
Knapp James N and Knapp Susan E
Home Financials for this Owner
Home Financials are based on the most recent Mortgage that was taken out on this home.
Original Mortgage
$114,900
Interest Rate
6.84%
Purchase Details
Closed on
May 8, 2001
Sold by
Hamel Martin J and Hamel Laura A
Bought by
Rafique Saima and Rafique Sumaira
Home Financials for this Owner
Home Financials are based on the most recent Mortgage that was taken out on this home.
Original Mortgage
$95,150
Interest Rate
7.15%
Mortgage Type
FHA
Create a Home Valuation Report for This Property
The Home Valuation Report is an in-depth analysis detailing your home's value as well as a comparison with similar homes in the area
Home Values in the Area
Average Home Value in this Area
Purchase History
| Date | Buyer | Sale Price | Title Company |
|---|---|---|---|
| Marquez Francisco J | $225,000 | Chicago Title | |
| Knapp James N | $118,500 | Fidelity National Title | |
| Rafique Saima | $96,000 | Fidelity National Title |
Source: Public Records
Mortgage History
| Date | Status | Borrower | Loan Amount |
|---|---|---|---|
| Open | Marquez Francisco J | $180,000 | |
| Previous Owner | Knapp James N | $114,900 | |
| Previous Owner | Rafique Saima | $95,150 |
Source: Public Records
Tax History Compared to Growth
Tax History
| Year | Tax Paid | Tax Assessment Tax Assessment Total Assessment is a certain percentage of the fair market value that is determined by local assessors to be the total taxable value of land and additions on the property. | Land | Improvement |
|---|---|---|---|---|
| 2025 | $1,854 | $54,565 | $33,950 | $20,615 |
| 2024 | $2,216 | $54,565 | $33,950 | $20,615 |
| 2023 | $627 | $49,778 | $31,150 | $18,628 |
| 2022 | $872 | $41,498 | $24,850 | $16,648 |
| 2021 | $808 | $38,612 | $23,100 | $15,512 |
| 2020 | $747 | $37,821 | $22,750 | $15,071 |
| 2019 | $700 | $33,435 | $18,900 | $14,535 |
| 2018 | $668 | $29,713 | $16,100 | $13,613 |
| 2017 | $913 | $27,840 | $14,350 | $13,490 |
| 2016 | $627 | $24,563 | $11,550 | $13,013 |
| 2015 | $624 | $21,353 | $8,750 | $12,603 |
| 2014 | $606 | $17,938 | $5,600 | $12,338 |
Source: Public Records
Map
Nearby Homes
- 709 Evergreen Cir
- 5613 Idle Ave
- 5705 Evergreen Ave
- 800 Antonio Dr
- 809 Upland Blvd
- 417 Wisteria Ave
- 5425 Evergreen Ave
- 5326 Evergreen Ave
- 6100 Alamo Cir
- 494 Fallwood Ln
- 340 Zion Dr
- 6120 Cairo Cir
- 6108 Kimberly Cir
- 468 Fallwood Ln
- 332 S Mallard St
- 329 Wisteria Ave
- 457 Purple Finch Dr
- 6204 W Charleston Blvd
- 309 Wisteria Ave
- 228 Falcon Ln