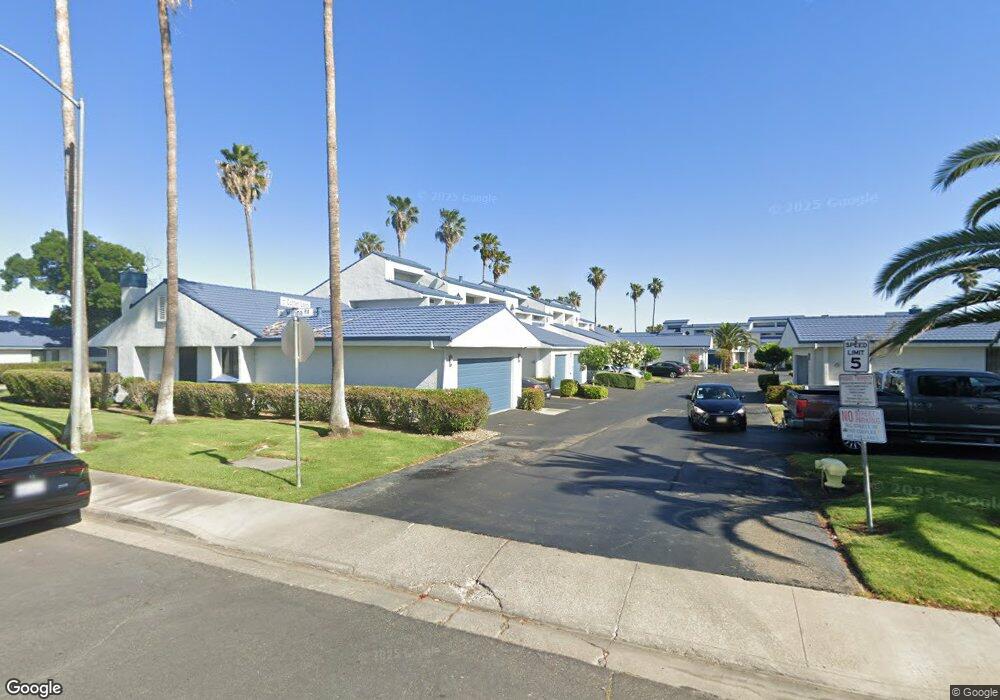
5709 Cutter Loop Unit 3 Discovery Bay, CA 94505
Estimated Value: $468,953 - $529,000
2
Beds
2
Baths
1,354
Sq Ft
$366/Sq Ft
Est. Value
About This Home
This home is located at 5709 Cutter Loop Unit 3, Discovery Bay, CA 94505 and is currently estimated at $495,238, approximately $365 per square foot. 5709 Cutter Loop Unit 3 is a home located in Contra Costa County with nearby schools including Discovery Bay Elementary School, Excelsior Middle School, and Liberty High School.
Ownership History
Date
Name
Owned For
Owner Type
Purchase Details
Closed on
Feb 2, 2015
Sold by
Lawbaugh William A and Lawbaugh Maria Elena
Bought by
William A & Maria Elena Lawbaugh Family
Current Estimated Value
Purchase Details
Closed on
Feb 18, 2003
Sold by
Armanino Maria Elena
Bought by
Lawbaugh William A and Lawbaugh Maria Elena
Home Financials for this Owner
Home Financials are based on the most recent Mortgage that was taken out on this home.
Original Mortgage
$58,000
Outstanding Balance
$24,804
Interest Rate
5.93%
Mortgage Type
Purchase Money Mortgage
Estimated Equity
$470,434
Purchase Details
Closed on
Jul 25, 1996
Sold by
New Discovery Inc
Bought by
Armanino Maria Elena
Home Financials for this Owner
Home Financials are based on the most recent Mortgage that was taken out on this home.
Original Mortgage
$55,000
Interest Rate
8.39%
Mortgage Type
Purchase Money Mortgage
Create a Home Valuation Report for This Property
The Home Valuation Report is an in-depth analysis detailing your home's value as well as a comparison with similar homes in the area
Home Values in the Area
Average Home Value in this Area
Purchase History
| Date | Buyer | Sale Price | Title Company |
|---|---|---|---|
| William A & Maria Elena Lawbaugh Family | -- | None Available | |
| Lawbaugh William A | -- | Old Republic Title | |
| Armanino Maria Elena | $103,000 | North American Title Co |
Source: Public Records
Mortgage History
| Date | Status | Borrower | Loan Amount |
|---|---|---|---|
| Open | Lawbaugh William A | $58,000 | |
| Closed | Armanino Maria Elena | $55,000 |
Source: Public Records
Tax History
| Year | Tax Paid | Tax Assessment Tax Assessment Total Assessment is a certain percentage of the fair market value that is determined by local assessors to be the total taxable value of land and additions on the property. | Land | Improvement |
|---|---|---|---|---|
| 2025 | $3,390 | $167,727 | $32,558 | $135,169 |
| 2024 | $3,083 | $164,439 | $31,920 | $132,519 |
| 2023 | $3,083 | $161,216 | $31,295 | $129,921 |
| 2022 | $3,025 | $158,056 | $30,682 | $127,374 |
| 2021 | $2,952 | $154,958 | $30,081 | $124,877 |
| 2019 | $2,867 | $150,364 | $29,190 | $121,174 |
| 2018 | $2,754 | $147,417 | $28,618 | $118,799 |
| 2017 | $2,727 | $144,527 | $28,057 | $116,470 |
| 2016 | $2,633 | $141,694 | $27,507 | $114,187 |
| 2015 | $2,535 | $139,566 | $27,094 | $112,472 |
| 2014 | $2,480 | $136,833 | $26,564 | $110,269 |
Source: Public Records
Map
Nearby Homes
- 1550 Trawler St
- 5580 Edgeview Dr
- 5570 Marlin Dr
- 5635 Marlin Dr
- 5541 Lanai Ct
- 5726 Marlin Dr
- 5770 Gateway Ct
- 2127 Prestwick Dr
- 2142 Prestwick Dr
- 1147 Willow Lake Rd
- 2270 Tamarisk Ct
- 1205 Beach Ct
- 910 Discovery Bay Blvd
- 1271 Discovery Bay Blvd
- 2110 Largo Ct
- 5761 Salmon Ct
- 2244 Colonial Ct
- 2205 Breaker Ct
- 2013 Sand Point Rd
- 5090 Double Point Way
- 5705 Cutter Loop
- 5711 Cutter Loop Unit 4
- 5701 Cutter Loop
- 5715 Cutter Loop Unit 5
- 5719 Cutter Loop
- 5708 Cutter Loop
- 5740 Cutter Loop
- 5702 Cutter Loop
- 5691 Schooner Loop
- 5695 Schooner Loop
- 5699 Schooner Loop Unit 26
- 5699 Schooner Loop
- 5687 Schooner Loop
- 5746 Cutter Loop
- 5683 Schooner Loop
- 5679 Schooner Loop
- 5723 Cutter Loop Unit 7
- 5723 Cutter Loop Unit 1
- 5723 Cutter Loop
- 5731 Cutter Loop
Your Personal Tour Guide
Ask me questions while you tour the home.