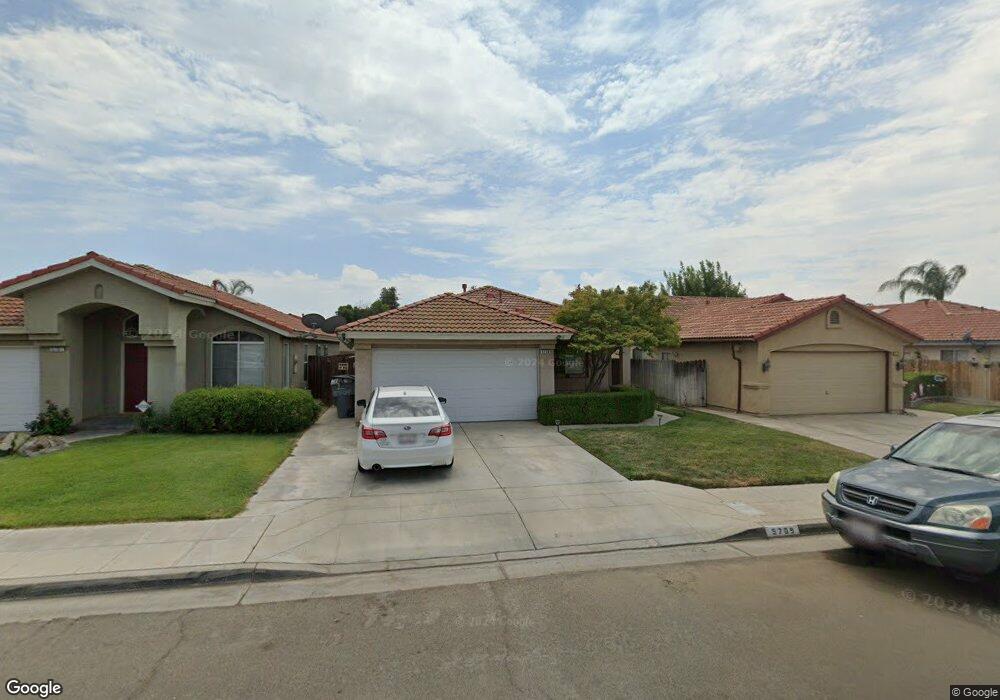
5709 W Vartikian Ave Fresno, CA 93722
Fig Garden Loop NeighborhoodEstimated Value: $339,000 - $368,000
3
Beds
2
Baths
1,202
Sq Ft
$296/Sq Ft
Est. Value
About This Home
This home is located at 5709 W Vartikian Ave, Fresno, CA 93722 and is currently estimated at $355,597, approximately $295 per square foot. 5709 W Vartikian Ave is a home located in Fresno County with nearby schools including William Saroyan Elementary School and Rio Vista Middle School.
Ownership History
Date
Name
Owned For
Owner Type
Purchase Details
Closed on
Aug 23, 2004
Sold by
Gill Jennifer A
Bought by
Gill Lawrence and Gill Jennifer A
Current Estimated Value
Home Financials for this Owner
Home Financials are based on the most recent Mortgage that was taken out on this home.
Original Mortgage
$146,000
Outstanding Balance
$72,159
Interest Rate
5.95%
Mortgage Type
New Conventional
Estimated Equity
$283,438
Purchase Details
Closed on
May 1, 2001
Sold by
Gill Larry C
Bought by
Gill Jennifer A
Purchase Details
Closed on
Mar 26, 1999
Sold by
Vanness Don R
Bought by
Gill Larry C and Gill Jennifer A
Home Financials for this Owner
Home Financials are based on the most recent Mortgage that was taken out on this home.
Original Mortgage
$92,843
Interest Rate
6.86%
Mortgage Type
FHA
Purchase Details
Closed on
Jul 16, 1996
Sold by
Jennifer Garcia John Ii Pok
Bought by
Vanness Don R
Create a Home Valuation Report for This Property
The Home Valuation Report is an in-depth analysis detailing your home's value as well as a comparison with similar homes in the area
Home Values in the Area
Average Home Value in this Area
Purchase History
| Date | Buyer | Sale Price | Title Company |
|---|---|---|---|
| Gill Lawrence | -- | Financial Title Company | |
| Gill Jennifer A | -- | -- | |
| Gill Larry C | $93,000 | Stewart Title | |
| Vanness Don R | -- | Fidelity National Title Co |
Source: Public Records
Mortgage History
| Date | Status | Borrower | Loan Amount |
|---|---|---|---|
| Open | Gill Lawrence | $146,000 | |
| Previous Owner | Gill Larry C | $92,843 |
Source: Public Records
Tax History Compared to Growth
Tax History
| Year | Tax Paid | Tax Assessment Tax Assessment Total Assessment is a certain percentage of the fair market value that is determined by local assessors to be the total taxable value of land and additions on the property. | Land | Improvement |
|---|---|---|---|---|
| 2025 | $1,879 | $145,773 | $47,019 | $98,754 |
| 2023 | $1,835 | $140,115 | $45,195 | $94,920 |
| 2022 | $1,733 | $137,368 | $44,309 | $93,059 |
| 2021 | $1,746 | $134,676 | $43,441 | $91,235 |
| 2020 | $1,662 | $133,296 | $42,996 | $90,300 |
| 2019 | $1,638 | $130,683 | $42,153 | $88,530 |
| 2018 | $1,601 | $128,122 | $41,327 | $86,795 |
| 2017 | $1,607 | $125,611 | $40,517 | $85,094 |
| 2016 | $1,483 | $123,149 | $39,723 | $83,426 |
| 2015 | $1,477 | $121,300 | $39,127 | $82,173 |
| 2014 | $1,476 | $118,925 | $38,361 | $80,564 |
Source: Public Records
Map
Nearby Homes
- 5753 W Ellery Ave
- 6324 N Wheeler Ave
- 5807 W Paul Ave
- 5628 W Mesa Ave
- 6294 W Northdale Ave
- 6220 N Ellendale Ave
- 6536 N Wheeler Ave
- 6671 N Sandrini Ave
- 6023 N Wheeler Ave
- 6075 W Menlo Ave
- 6675 N Lola Ave
- 6583 N State Ave
- 5802 W Millbrae Ave
- 6062 N Constance Ave
- 5657 N Wheeler Ave
- 5504 W Browning Ave
- 5483 W Roberts Ave
- 5989 W Turtle Bay Dr
- 6542 N Brix Ave
- 5468 N Delbert Ave
- 5717 W Vartikian Ave
- 5701 W Vartikian Ave
- 5693 W Vartikian Ave
- 5725 W Vartikian Ave
- 5706 W Sample Ave
- 5714 W Sample Ave
- 5698 W Sample Ave
- 5733 W Vartikian Ave
- 5685 W Vartikian Ave
- 5722 W Sample Ave
- 5690 W Sample Ave
- 5710 W Vartikian Ave
- 5718 W Vartikian Ave
- 5702 W Vartikian Ave
- 5682 W Sample Ave
- 5730 W Sample Ave
- 5677 W Vartikian Ave
- 5741 W Vartikian Ave
- 5726 W Vartikian Ave
- 5694 W Vartikian Ave