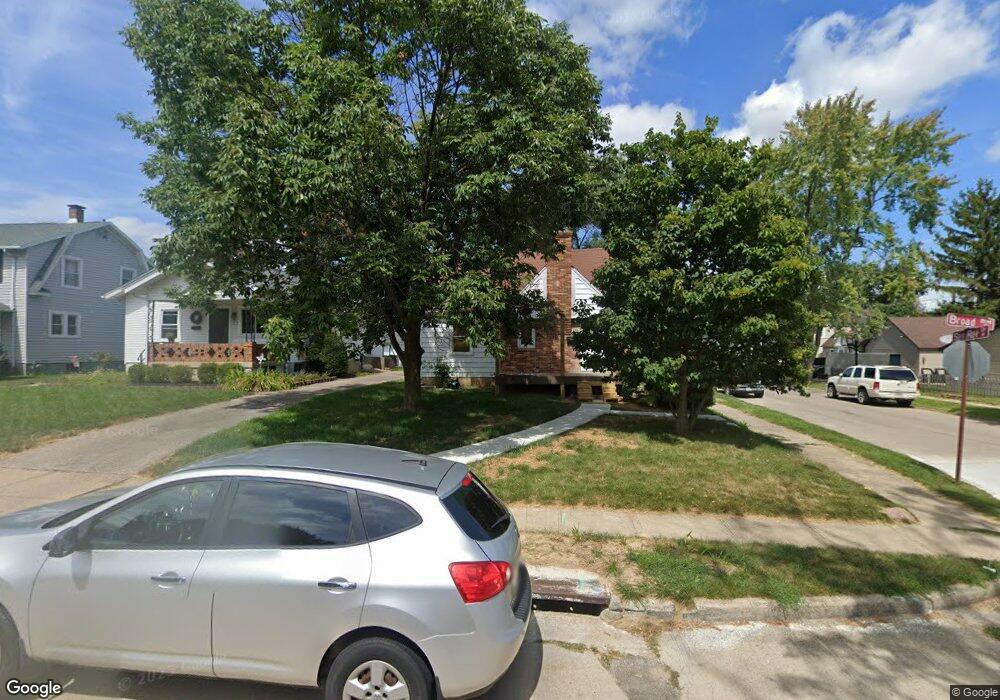
571 Broad Blvd Dayton, OH 45419
Estimated Value: $168,000 - $210,000
2
Beds
1
Bath
1,141
Sq Ft
$171/Sq Ft
Est. Value
About This Home
This home is located at 571 Broad Blvd, Dayton, OH 45419 and is currently estimated at $195,451, approximately $171 per square foot. 571 Broad Blvd is a home located in Montgomery County with nearby schools including Orchard Park Elementary School, Van Buren Middle School, and Kettering Fairmont High School.
Ownership History
Date
Name
Owned For
Owner Type
Purchase Details
Closed on
Feb 21, 2020
Sold by
Davies James M
Bought by
Cotton Daniel U and Cotton Amanda S
Current Estimated Value
Home Financials for this Owner
Home Financials are based on the most recent Mortgage that was taken out on this home.
Original Mortgage
$94,090
Outstanding Balance
$83,310
Interest Rate
3.6%
Mortgage Type
New Conventional
Estimated Equity
$112,141
Purchase Details
Closed on
Dec 1, 2004
Sold by
Kilheffer Jennifer D
Bought by
Davies James M and Davies Deann N
Home Financials for this Owner
Home Financials are based on the most recent Mortgage that was taken out on this home.
Original Mortgage
$114,098
Interest Rate
5.71%
Mortgage Type
FHA
Purchase Details
Closed on
Oct 17, 2002
Sold by
Weymouth David E and Weymouth Kathryn B
Bought by
Kilheffer Jennifer D
Home Financials for this Owner
Home Financials are based on the most recent Mortgage that was taken out on this home.
Original Mortgage
$89,100
Interest Rate
6.29%
Create a Home Valuation Report for This Property
The Home Valuation Report is an in-depth analysis detailing your home's value as well as a comparison with similar homes in the area
Home Values in the Area
Average Home Value in this Area
Purchase History
| Date | Buyer | Sale Price | Title Company |
|---|---|---|---|
| Cotton Daniel U | $97,000 | Fidelity Lawyers Ttl Agcy Ll | |
| Davies James M | $115,000 | None Available | |
| Kilheffer Jennifer D | $99,000 | Sterling Land Title Agency I |
Source: Public Records
Mortgage History
| Date | Status | Borrower | Loan Amount |
|---|---|---|---|
| Open | Cotton Daniel U | $94,090 | |
| Previous Owner | Davies James M | $114,098 | |
| Previous Owner | Kilheffer Jennifer D | $89,100 |
Source: Public Records
Tax History Compared to Growth
Tax History
| Year | Tax Paid | Tax Assessment Tax Assessment Total Assessment is a certain percentage of the fair market value that is determined by local assessors to be the total taxable value of land and additions on the property. | Land | Improvement |
|---|---|---|---|---|
| 2024 | $3,082 | $48,280 | $9,970 | $38,310 |
| 2023 | $3,082 | $48,280 | $9,970 | $38,310 |
| 2022 | $2,932 | $36,310 | $7,500 | $28,810 |
| 2021 | $2,718 | $36,310 | $7,500 | $28,810 |
| 2020 | $2,667 | $36,310 | $7,500 | $28,810 |
| 2019 | $2,785 | $29,840 | $6,810 | $23,030 |
| 2018 | $2,024 | $29,840 | $6,810 | $23,030 |
| 2017 | $1,886 | $29,840 | $6,810 | $23,030 |
| 2016 | $1,962 | $29,510 | $6,810 | $22,700 |
| 2015 | $1,638 | $29,510 | $6,810 | $22,700 |
| 2014 | $1,638 | $29,510 | $6,810 | $22,700 |
| 2012 | -- | $31,060 | $6,830 | $24,230 |
Source: Public Records
Map
Nearby Homes
- 2701 Aerial Ave
- 2817 Royalston Ave
- 651 Broad Blvd
- 663 Broad Blvd
- 445 Peach Orchard Ave
- 349 Orchard Dr
- 545 Monteray Ave
- 436 Monteray Ave
- 2119 Shroyer Rd
- 709 E Dorothy Ln
- 320 Brydon Rd
- 2601 Oakley Ave
- 2004 Shroyer Rd
- 401 Hadley Ave
- 441 Cushing Ave
- 355 Hadley Ave
- 1916 Shroyer Rd
- 320 E Dorothy Ln
- 235 Claranna Ave
- 538 Wiltshire Blvd
- 567 Broad Blvd
- 563 Broad Blvd
- 2729 San Rae Dr
- 601 Broad Blvd
- 2725 San Rae Dr
- 2728 San Rae Dr
- 605 Broad Blvd
- 559 Broad Blvd
- 2721 San Rae Dr
- 2724 San Rae Dr
- 609 Broad Blvd
- 555 Broad Blvd
- 2801 San Rae Dr
- 566 Broad Blvd
- 2728 Aerial Ave
- 2717 San Rae Dr
- 562 Broad Blvd
- 2724 Aerial Ave
- 613 Broad Blvd
- 551 Broad Blvd