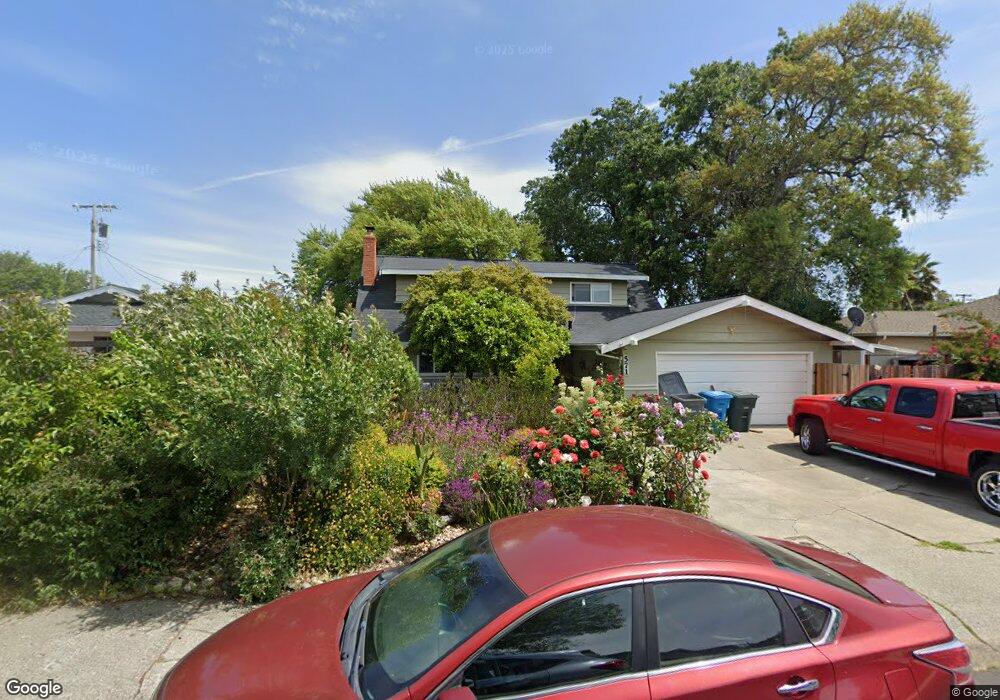
571 Camellia Way Vacaville, CA 95688
Estimated Value: $506,000 - $536,000
4
Beds
2
Baths
1,520
Sq Ft
$344/Sq Ft
Est. Value
About This Home
This home is located at 571 Camellia Way, Vacaville, CA 95688 and is currently estimated at $522,240, approximately $343 per square foot. 571 Camellia Way is a home located in Solano County with nearby schools including Alamo Elementary School, Orchard Elementary School, and Willis Jepson Middle School.
Ownership History
Date
Name
Owned For
Owner Type
Purchase Details
Closed on
Jul 28, 2015
Sold by
Darnell Larry L
Bought by
Darnell Larry L and Darnell Living Trust
Current Estimated Value
Purchase Details
Closed on
Sep 1, 2009
Sold by
Aurora Loan Services Llc
Bought by
Darnell Larry L and Darnell Anne
Home Financials for this Owner
Home Financials are based on the most recent Mortgage that was taken out on this home.
Original Mortgage
$140,720
Outstanding Balance
$91,515
Interest Rate
5.08%
Mortgage Type
New Conventional
Estimated Equity
$430,725
Purchase Details
Closed on
May 14, 2009
Sold by
Jensen Tracy A
Bought by
Aurora Loan Services Llc
Purchase Details
Closed on
Oct 28, 1997
Sold by
Jensen Gary
Bought by
Jensen Tracy A
Home Financials for this Owner
Home Financials are based on the most recent Mortgage that was taken out on this home.
Original Mortgage
$101,500
Interest Rate
7.36%
Create a Home Valuation Report for This Property
The Home Valuation Report is an in-depth analysis detailing your home's value as well as a comparison with similar homes in the area
Home Values in the Area
Average Home Value in this Area
Purchase History
| Date | Buyer | Sale Price | Title Company |
|---|---|---|---|
| Darnell Larry L | -- | None Available | |
| Darnell Larry L | $176,000 | North American Title Company | |
| Aurora Loan Services Llc | $266,088 | Accommodation | |
| Jensen Tracy A | -- | North American Title Co | |
| Jensen Tracy A | $140,000 | North American Title Co |
Source: Public Records
Mortgage History
| Date | Status | Borrower | Loan Amount |
|---|---|---|---|
| Open | Darnell Larry L | $140,720 | |
| Previous Owner | Jensen Tracy A | $101,500 |
Source: Public Records
Tax History Compared to Growth
Tax History
| Year | Tax Paid | Tax Assessment Tax Assessment Total Assessment is a certain percentage of the fair market value that is determined by local assessors to be the total taxable value of land and additions on the property. | Land | Improvement |
|---|---|---|---|---|
| 2025 | $2,617 | $227,044 | $49,046 | $177,998 |
| 2024 | $2,617 | $222,593 | $48,085 | $174,508 |
| 2023 | $2,556 | $218,230 | $47,143 | $171,087 |
| 2022 | $2,489 | $213,952 | $46,219 | $167,733 |
| 2021 | $2,494 | $209,758 | $45,313 | $164,445 |
| 2020 | $2,461 | $207,608 | $44,849 | $162,759 |
| 2019 | $2,419 | $203,538 | $43,970 | $159,568 |
| 2018 | $2,392 | $199,548 | $43,108 | $156,440 |
| 2017 | $2,313 | $195,636 | $42,263 | $153,373 |
| 2016 | $2,713 | $191,801 | $41,435 | $150,366 |
| 2015 | $2,684 | $188,921 | $40,813 | $148,108 |
| 2014 | $2,498 | $185,221 | $40,014 | $145,207 |
Source: Public Records
Map
Nearby Homes
- 721 Camellia Way
- 680 S Orchard Ave
- 818 Lovers Ln
- 571 Nottingham Dr
- 569 Alamo Dr
- 491 Buck Ave
- 0 Merchant St Unit 325089259
- 253 W Kendal St
- 970 El Camino Ave Unit 3
- 149 Mason St
- 149 Fairoaks Dr
- 100 Ramona St
- 365 Acacia St
- 101 Main St
- 124 Main St
- 376 Bishop Dr
- 0 Cernon St Unit 325065048
- 0 Parker St Unit 324045416
- 332 Cottonwood St
- 507 Buckeye St
- 651 Camellia Way
- 561 Camellia Way
- 518 Lovers Ln
- 560 Camellia Way
- 570 Camellia Way
- 521 Camellia Way
- 670 Lovers Ln
- 514 Lovers Ln
- 550 Camellia Way
- 650 Camellia Way
- 530 Camellia Way
- 671 Camellia Way
- 660 Camellia Way
- 511 Camellia Way
- 520 Camellia Way
- 581 Azalea Way
- 541 Azalea Way
- 680 Lovers Ln
- 651 Azalea Way