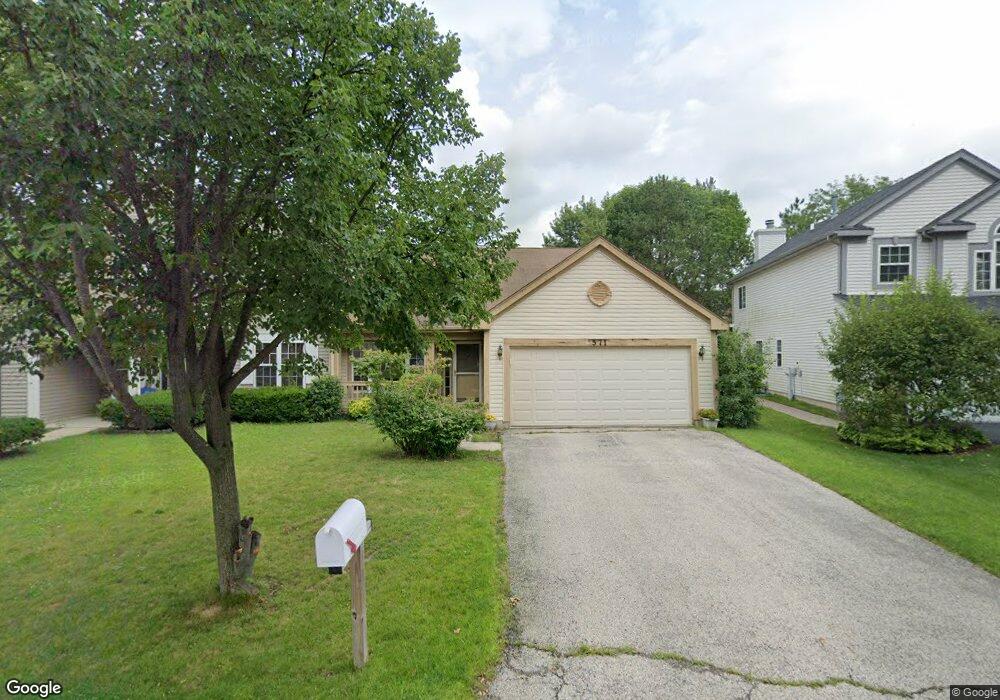
571 Colton Rd Grayslake, IL 60030
Estimated Value: $312,000 - $326,857
3
Beds
2
Baths
1,462
Sq Ft
$217/Sq Ft
Est. Value
About This Home
This home is located at 571 Colton Rd, Grayslake, IL 60030 and is currently estimated at $316,964, approximately $216 per square foot. 571 Colton Rd is a home located in Lake County with nearby schools including Frederick School, Woodview School, and Grayslake Middle School.
Ownership History
Date
Name
Owned For
Owner Type
Purchase Details
Closed on
Dec 16, 2002
Sold by
Redding Aileen A
Bought by
Redding Loren M
Current Estimated Value
Home Financials for this Owner
Home Financials are based on the most recent Mortgage that was taken out on this home.
Original Mortgage
$153,000
Outstanding Balance
$65,673
Interest Rate
6.23%
Mortgage Type
Seller Take Back
Estimated Equity
$251,291
Purchase Details
Closed on
Dec 30, 2000
Sold by
Healey Shawn F and Healey Colette M
Bought by
Redding James M
Purchase Details
Closed on
Jun 15, 1995
Sold by
Nothern Tr Bank Lake Forest Natl Assn
Bought by
Healey Shawn F and Healey Colette M
Home Financials for this Owner
Home Financials are based on the most recent Mortgage that was taken out on this home.
Original Mortgage
$142,894
Interest Rate
7.51%
Mortgage Type
FHA
Create a Home Valuation Report for This Property
The Home Valuation Report is an in-depth analysis detailing your home's value as well as a comparison with similar homes in the area
Home Values in the Area
Average Home Value in this Area
Purchase History
| Date | Buyer | Sale Price | Title Company |
|---|---|---|---|
| Redding Loren M | $153,000 | -- | |
| Redding Aileen A | -- | -- | |
| Redding James M | $153,000 | Chicago Title Insurance Co | |
| Healey Shawn F | $148,000 | Ticor Title Insurance Compan |
Source: Public Records
Mortgage History
| Date | Status | Borrower | Loan Amount |
|---|---|---|---|
| Open | Redding Loren M | $153,000 | |
| Previous Owner | Healey Shawn F | $142,894 |
Source: Public Records
Tax History
| Year | Tax Paid | Tax Assessment Tax Assessment Total Assessment is a certain percentage of the fair market value that is determined by local assessors to be the total taxable value of land and additions on the property. | Land | Improvement |
|---|---|---|---|---|
| 2024 | $5,632 | $77,508 | $18,013 | $59,495 |
| 2023 | $6,342 | $71,135 | $16,532 | $54,603 |
| 2022 | $6,342 | $63,874 | $10,510 | $53,364 |
| 2021 | $6,203 | $56,157 | $10,102 | $46,055 |
| 2020 | $6,186 | $53,432 | $9,612 | $43,820 |
| 2019 | $7,086 | $59,801 | $9,222 | $50,579 |
| 2018 | $6,559 | $56,242 | $11,201 | $45,041 |
| 2017 | $6,564 | $52,904 | $10,536 | $42,368 |
| 2016 | $6,227 | $53,457 | $9,726 | $43,731 |
| 2015 | $6,696 | $48,837 | $8,885 | $39,952 |
| 2014 | $6,479 | $47,174 | $9,094 | $38,080 |
| 2012 | $6,400 | $49,268 | $9,498 | $39,770 |
Source: Public Records
Map
Nearby Homes
- 860 Amelia Ct
- 831 Amelia Ct
- 275 N Cambridge Ct
- 673 Cardinal Ct
- 130 Whitehall Ct
- 1095 Ellsworth Dr
- 470 Ziegler Dr
- 20295 W Washington St
- 701 Caitlin Ct
- 417 Lawrence Ave
- 11 Spinnaker Ct
- 15010 W Belvidere Rd
- 354 Stevens Ct
- 33771 N 2nd St
- 1544 Syracuse Dr
- 367 N Lake St
- 18631 W Main St
- 33762 N Oak St
- 146 Westerfield Place
- 75 Whispering Oaks Ln
- 581 Colton Rd
- 561 Colton Rd
- 551 Colton Rd
- 1053 Blackburn Dr
- 1091 Blackburn Dr
- 1085 Blackburn Dr
- 1047 Blackburn Dr
- 1065 Blackburn Dr
- 1065 Blackburn Dr
- 1103 Blackburn Dr
- 1077 Blackburn Dr
- 541 Colton Rd
- 578 Colton Rd
- 568 Colton Rd
- 588 Colton Rd
- 531 Colton Rd
- 1115 Blackburn Dr
- 558 Colton Rd
- 558 Colton Rd Unit 4
- 598 Colton Rd
Your Personal Tour Guide
Ask me questions while you tour the home.