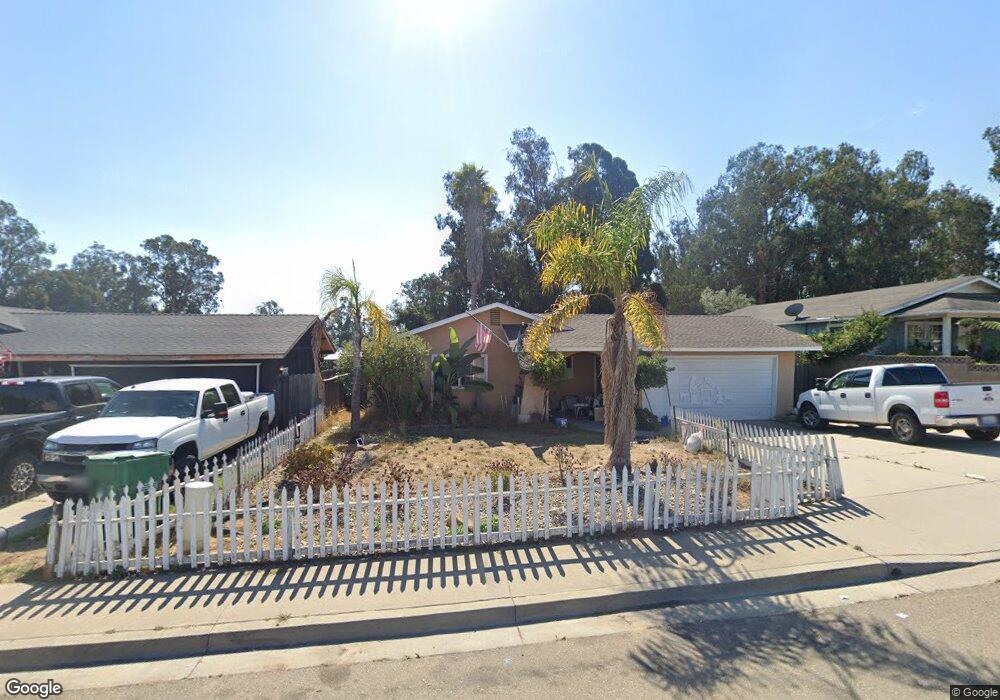
571 Division St Nipomo, CA 93444
Estimated Value: $558,000 - $668,000
3
Beds
2
Baths
1,138
Sq Ft
$538/Sq Ft
Est. Value
About This Home
This home is located at 571 Division St, Nipomo, CA 93444 and is currently estimated at $612,311, approximately $538 per square foot. 571 Division St is a home located in San Luis Obispo County with nearby schools including Dorothea Lange Elementary School, Mesa Middle School, and Nipomo High School.
Ownership History
Date
Name
Owned For
Owner Type
Purchase Details
Closed on
Apr 23, 1998
Sold by
Delfin Anna Maria and Delfin Audrey Marie
Bought by
Robertson Robert and Robertson Melissa
Current Estimated Value
Home Financials for this Owner
Home Financials are based on the most recent Mortgage that was taken out on this home.
Original Mortgage
$86,810
Outstanding Balance
$16,551
Interest Rate
7.15%
Mortgage Type
FHA
Estimated Equity
$595,760
Purchase Details
Closed on
Apr 10, 1998
Sold by
Delfin Anna Maria and Delfin Audrey Maria
Bought by
Robertson Robert and Robertson Melissa
Home Financials for this Owner
Home Financials are based on the most recent Mortgage that was taken out on this home.
Original Mortgage
$86,810
Outstanding Balance
$16,551
Interest Rate
7.15%
Mortgage Type
FHA
Estimated Equity
$595,760
Purchase Details
Closed on
Apr 25, 1994
Sold by
Zepeda Maria Guadalupe
Bought by
Zepeda Jose S
Home Financials for this Owner
Home Financials are based on the most recent Mortgage that was taken out on this home.
Original Mortgage
$125,000
Interest Rate
8.3%
Create a Home Valuation Report for This Property
The Home Valuation Report is an in-depth analysis detailing your home's value as well as a comparison with similar homes in the area
Home Values in the Area
Average Home Value in this Area
Purchase History
| Date | Buyer | Sale Price | Title Company |
|---|---|---|---|
| Robertson Robert | $105,000 | Fidelity National Title Co | |
| Robertson Robert | $105,000 | Fidelity National Title Co | |
| Zepeda Jose S | -- | Ticor Title Insurance Compan | |
| Delfin Anna Maria | $121,000 | Ticor Title Insurance Compan |
Source: Public Records
Mortgage History
| Date | Status | Borrower | Loan Amount |
|---|---|---|---|
| Open | Robertson Robert | $86,810 | |
| Previous Owner | Delfin Anna Maria | $125,000 |
Source: Public Records
Tax History Compared to Growth
Tax History
| Year | Tax Paid | Tax Assessment Tax Assessment Total Assessment is a certain percentage of the fair market value that is determined by local assessors to be the total taxable value of land and additions on the property. | Land | Improvement |
|---|---|---|---|---|
| 2025 | $1,723 | $167,468 | $95,788 | $71,680 |
| 2024 | $1,703 | $164,185 | $93,910 | $70,275 |
| 2023 | $1,703 | $160,967 | $92,069 | $68,898 |
| 2022 | $1,677 | $157,812 | $90,264 | $67,548 |
| 2021 | $1,674 | $154,719 | $88,495 | $66,224 |
| 2020 | $1,655 | $153,133 | $87,588 | $65,545 |
| 2019 | $1,645 | $150,131 | $85,871 | $64,260 |
| 2018 | $1,625 | $147,188 | $84,188 | $63,000 |
| 2017 | $1,595 | $144,303 | $82,538 | $61,765 |
| 2016 | $1,504 | $141,474 | $80,920 | $60,554 |
| 2015 | $1,483 | $139,350 | $79,705 | $59,645 |
| 2014 | $1,428 | $136,621 | $78,144 | $58,477 |
Source: Public Records
Map
Nearby Homes
- 626 Juno Ct
- 450 Avenida de Socios Unit 12
- 368 Avenida de Amigos
- 525 Grande Ave Unit D
- 483 Violet Ave
- 725 Monarch Ln
- 232 Scarlett Cir
- 522 Higos Way
- 424 Bermuda Place
- Mesa Plan at Hill Street Terraces - Hill Street Series
- Pacific Plan at Hill Street Terraces - Hill Street Series
- Monarch Plan at Hill Street Terraces - Hill Street Series
- Rancho Plan at Hill Street Terraces - Hill Street Series
- Dana Plan at Hill Street Terraces - Hill Street Series
- 840 Story St
- 680 Hill St
- 449 W Tefft St Unit 23
- 449 W Tefft St Unit 13
- 719 W Tefft St
- 945 Jeanette Ln
- 561 Division St
- 581 Division St
- 591 Division St
- 504 Avenida Montecito Verde
- 508 Avenida Montecito Verde
- 516 Avenida Montecito Verde
- 601 Division St
- 520 Avenida Montecito Verde
- 539 January St
- 611 Division St
- 524 Avenida Montecito Verde
- 548 January St
- 528 Avenida Montecito Verde
- 503 Avenida Montecito Verde
- 507 Avenida Montecito Verde
- 511 Avenida Montecito Verde
- 490 Brytec Ct
- 532 Avenida Montecito Verde
- 625 Juno Ct
- 515 Avenida Montecito Verde