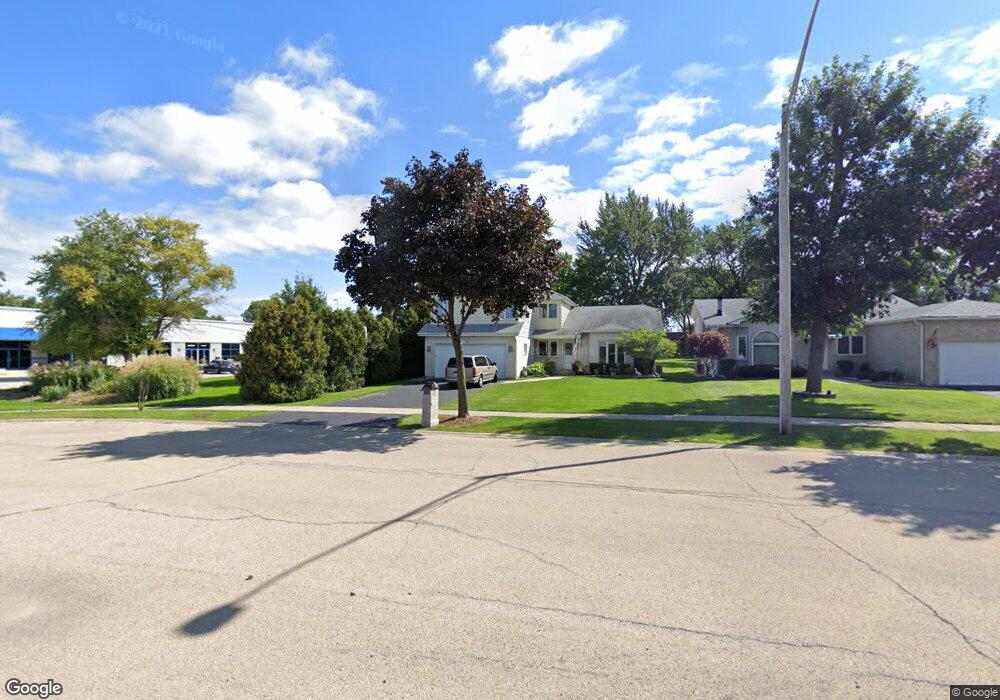
571 John St Bensenville, IL 60106
Estimated Value: $448,000 - $490,000
--
Bed
1
Bath
2,450
Sq Ft
$192/Sq Ft
Est. Value
About This Home
This home is located at 571 John St, Bensenville, IL 60106 and is currently estimated at $470,864, approximately $192 per square foot. 571 John St is a home located in DuPage County with nearby schools including Tioga Elementary School, Blackhawk Middle School, and Fenton High School.
Ownership History
Date
Name
Owned For
Owner Type
Purchase Details
Closed on
May 18, 2009
Sold by
Nelson James S and Nelson Laura A
Bought by
Nelson James S and Nelson Laura A
Current Estimated Value
Home Financials for this Owner
Home Financials are based on the most recent Mortgage that was taken out on this home.
Original Mortgage
$201,500
Outstanding Balance
$130,768
Interest Rate
5.36%
Mortgage Type
Stand Alone Refi Refinance Of Original Loan
Estimated Equity
$340,096
Purchase Details
Closed on
Sep 27, 2004
Sold by
Nelson James S and Nelson Laura
Bought by
Nelson James S and Nelson Laura A
Purchase Details
Closed on
Apr 25, 2001
Sold by
Dixon George W
Bought by
Nelson James S and Nelson Laura
Home Financials for this Owner
Home Financials are based on the most recent Mortgage that was taken out on this home.
Original Mortgage
$130,000
Interest Rate
7.02%
Create a Home Valuation Report for This Property
The Home Valuation Report is an in-depth analysis detailing your home's value as well as a comparison with similar homes in the area
Home Values in the Area
Average Home Value in this Area
Purchase History
| Date | Buyer | Sale Price | Title Company |
|---|---|---|---|
| Nelson James S | -- | Citywide Title Corporation | |
| Nelson James S | -- | -- | |
| Nelson James S | $210,000 | First American Title Ins |
Source: Public Records
Mortgage History
| Date | Status | Borrower | Loan Amount |
|---|---|---|---|
| Open | Nelson James S | $201,500 | |
| Closed | Nelson James S | $130,000 |
Source: Public Records
Tax History Compared to Growth
Tax History
| Year | Tax Paid | Tax Assessment Tax Assessment Total Assessment is a certain percentage of the fair market value that is determined by local assessors to be the total taxable value of land and additions on the property. | Land | Improvement |
|---|---|---|---|---|
| 2024 | $12,120 | $147,397 | $38,856 | $108,541 |
| 2023 | $11,492 | $135,500 | $35,720 | $99,780 |
| 2022 | $11,023 | $127,180 | $33,210 | $93,970 |
| 2021 | $11,023 | $121,820 | $31,810 | $90,010 |
| 2020 | $10,150 | $116,690 | $30,470 | $86,220 |
| 2019 | $9,575 | $112,200 | $29,300 | $82,900 |
| 2018 | $9,569 | $110,310 | $29,300 | $81,010 |
| 2017 | $9,265 | $105,420 | $28,000 | $77,420 |
| 2016 | $8,914 | $97,330 | $25,850 | $71,480 |
| 2015 | $8,667 | $89,910 | $23,880 | $66,030 |
| 2014 | $8,755 | $90,070 | $27,360 | $62,710 |
| 2013 | $8,672 | $91,910 | $27,920 | $63,990 |
Source: Public Records
Map
Nearby Homes
- 669 Redmond Ct
- 809 Brentwood Dr
- 859 John St
- 499 Park St Unit 2D
- 342 Diana Ct
- 311 George St
- 284 E Jefferson St
- 424 May St
- 128 David Dr
- 3112 Pearl Ave
- 449 S Addison St
- 1043 S York Rd Unit 209
- 1043 S York Rd Unit 208
- 1043 S York Rd Unit 411
- 1043 S York Rd Unit 605
- 227-239 W Irving Park Rd
- 245 S Addison St
- 11353 W Grand Ave
- 3N276 N Howard Ave
- 2939 Haber Ave
- 581 John St
- 591 John St
- 601 John St
- 633 John St
- 626 County Line Rd
- 556 County Line Rd Unit D
- 600 County Line Rd Unit 1NW
- 600 County Line Rd Unit 1N
- 600 County Line Rd Unit 1NWH
- 600 County Line Rd Unit 1SW
- 600 County Line Rd Unit 1SE
- 600 County Line Rd Unit 2SE
- 600 County Line Rd
- 570 County Line Rd
- 647 John St
- 4N530 County Line Rd
- 640 County Line Rd
- 66981 S John St
- 620 County Line Rd
- 520 County Line Rd