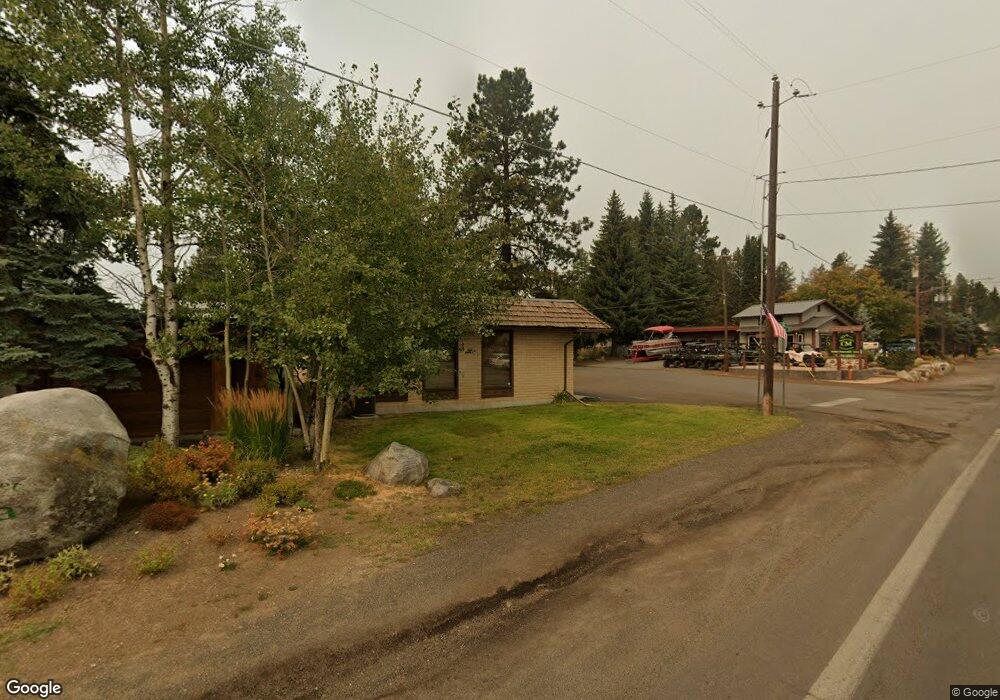
571 Sheila Ln McCall, ID 83638
Estimated Value: $540,628 - $781,000
3
Beds
1
Bath
1,500
Sq Ft
$463/Sq Ft
Est. Value
About This Home
This home is located at 571 Sheila Ln, McCall, ID 83638 and is currently estimated at $694,907, approximately $463 per square foot. 571 Sheila Ln is a home with nearby schools including McCall-Donnelly High School, Mountain Life Education, and The North Fork School.
Ownership History
Date
Name
Owned For
Owner Type
Purchase Details
Closed on
May 22, 2008
Sold by
Gingrich Sandra Kay
Bought by
Callaham Kevin T and Gingrich Sandra K
Current Estimated Value
Home Financials for this Owner
Home Financials are based on the most recent Mortgage that was taken out on this home.
Original Mortgage
$205,000
Outstanding Balance
$130,975
Interest Rate
6.05%
Mortgage Type
New Conventional
Estimated Equity
$563,932
Purchase Details
Closed on
Jan 21, 2005
Sold by
Purcell Cleo B and Frost Richard Dorwin
Bought by
Gingrich Sandra Kay
Home Financials for this Owner
Home Financials are based on the most recent Mortgage that was taken out on this home.
Original Mortgage
$190,000
Interest Rate
8.5%
Mortgage Type
Adjustable Rate Mortgage/ARM
Purchase Details
Closed on
Jan 1, 2005
Sold by
Purcell Cleo B and Frost Richard Dorwin
Bought by
Gingrich Sandra Kay
Home Financials for this Owner
Home Financials are based on the most recent Mortgage that was taken out on this home.
Original Mortgage
$190,000
Interest Rate
8.5%
Mortgage Type
Adjustable Rate Mortgage/ARM
Create a Home Valuation Report for This Property
The Home Valuation Report is an in-depth analysis detailing your home's value as well as a comparison with similar homes in the area
Home Values in the Area
Average Home Value in this Area
Purchase History
| Date | Buyer | Sale Price | Title Company |
|---|---|---|---|
| Callaham Kevin T | -- | -- | |
| Gingrich Sandra Kay | -- | -- | |
| Gingrich Sandra Kay | -- | -- |
Source: Public Records
Mortgage History
| Date | Status | Borrower | Loan Amount |
|---|---|---|---|
| Open | Callaham Kevin T | $205,000 | |
| Previous Owner | Gingrich Sandra Kay | $190,000 |
Source: Public Records
Tax History
| Year | Tax Paid | Tax Assessment Tax Assessment Total Assessment is a certain percentage of the fair market value that is determined by local assessors to be the total taxable value of land and additions on the property. | Land | Improvement |
|---|---|---|---|---|
| 2025 | $870 | $486,252 | $167,810 | $318,442 |
| 2023 | $870 | $515,411 | $209,763 | $305,648 |
| 2022 | $1,036 | $513,966 | $244,886 | $269,080 |
| 2021 | $752 | $293,926 | $67,950 | $225,976 |
| 2020 | $784 | $248,924 | $52,046 | $196,878 |
| 2019 | $844 | $253,272 | $52,046 | $201,226 |
| 2018 | $748 | $226,064 | $59,614 | $166,450 |
| 2017 | $686 | $198,456 | $42,001 | $156,455 |
| 2016 | $635 | $177,398 | $35,396 | $142,002 |
| 2015 | $652 | $175,167 | $0 | $0 |
| 2013 | -- | $155,037 | $0 | $0 |
Source: Public Records
Map
Nearby Homes
- TBD E Jacob St
- TBD 2 Elo Rd
- TBD 5 Elo Rd
- 503 S Third St
- 413 S 3rd St
- 162 Fox Ln
- 649 Brady Dr
- 1201 S Samson Trail
- 644 Woodlands Dr
- 430 Ringel St
- TBD Mcbride St
- Lot 19 To Be Determined Unit 19
- Lot 28 To Be Determined Unit 28
- TBD Sunbridge Dr Unit 3-6,9, 10, 12-15
- Lot 11 To Be Determined Unit 11
- Lot 18 To Be Determined Unit 18
- Lot 29 To Be Determined Unit 29
- Lot 20 To Be Determined Unit 20
- Lot 8 To Be Determined Unit 8
- TBD Sunbridge Dr
- 327 Julie Ln
- 640 Julies Rd
- 635 S Samson Trail
- 625 Shelia Ln
- 625 Sheila Ln
- 551 Sheila Ln
- TBD Lot 4 Blk 1 Sheila Ln
- 000 Julie's Rd
- 651 Shelia Ln
- 551 S Samson Trail
- 695 S Samson Trail
- 641 Ellis Rd
- 675 Sheila Ln
- 650 Sheila Ln
- 495 S Samson Trail Unit 11 & 12
- Tax #36 S Samson Trail
- 495 S Samson Trail
- XYZ S Samson Trail
- 441 Krahn Ln
- 000 Ellis
Your Personal Tour Guide
Ask me questions while you tour the home.