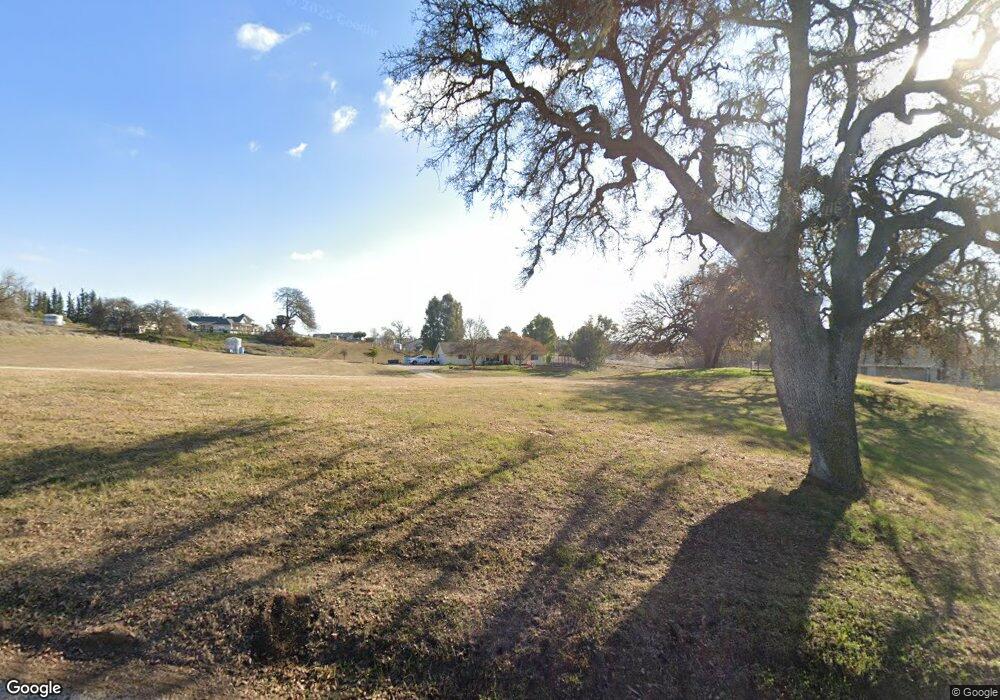
5710 Prancing Deer Place Paso Robles, CA 93446
Estimated Value: $738,000 - $897,000
4
Beds
2
Baths
1,662
Sq Ft
$474/Sq Ft
Est. Value
About This Home
This home is located at 5710 Prancing Deer Place, Paso Robles, CA 93446 and is currently estimated at $788,108, approximately $474 per square foot. 5710 Prancing Deer Place is a home located in San Luis Obispo County with nearby schools including Kermit King Elementary School, Daniel Lewis Middle School, and Paso Robles High School.
Ownership History
Date
Name
Owned For
Owner Type
Purchase Details
Closed on
Mar 3, 2022
Sold by
Cone Norman L and 2008 Esther
Bought by
Cone Norman and Cone Esther
Current Estimated Value
Home Financials for this Owner
Home Financials are based on the most recent Mortgage that was taken out on this home.
Original Mortgage
$60,000
Outstanding Balance
$54,257
Interest Rate
3.92%
Mortgage Type
Credit Line Revolving
Estimated Equity
$733,851
Purchase Details
Closed on
Jul 23, 2009
Sold by
Cone Norman L and Cone Esther J
Bought by
Cone Norman L and Cone Esther J
Home Financials for this Owner
Home Financials are based on the most recent Mortgage that was taken out on this home.
Original Mortgage
$280,000
Interest Rate
5.31%
Mortgage Type
New Conventional
Purchase Details
Closed on
Jul 22, 2008
Sold by
Cone Norman L and Cone Esther Joy
Bought by
Cone Norman J and Cone Esther J
Create a Home Valuation Report for This Property
The Home Valuation Report is an in-depth analysis detailing your home's value as well as a comparison with similar homes in the area
Purchase History
| Date | Buyer | Sale Price | Title Company |
|---|---|---|---|
| Cone Norman | -- | First American Title | |
| Cone Norman L | -- | Fidelity National Title Co | |
| Cone Norman J | -- | None Available |
Source: Public Records
Mortgage History
| Date | Status | Borrower | Loan Amount |
|---|---|---|---|
| Open | Cone Norman | $60,000 | |
| Previous Owner | Cone Norman L | $280,000 |
Source: Public Records
Tax History
| Year | Tax Paid | Tax Assessment Tax Assessment Total Assessment is a certain percentage of the fair market value that is determined by local assessors to be the total taxable value of land and additions on the property. | Land | Improvement |
|---|---|---|---|---|
| 2025 | $2,834 | $228,243 | $73,715 | $154,528 |
| 2024 | $2,791 | $223,769 | $72,270 | $151,499 |
| 2023 | $2,791 | $219,382 | $70,853 | $148,529 |
| 2022 | $2,747 | $215,081 | $69,464 | $145,617 |
| 2021 | $2,702 | $210,864 | $68,102 | $142,762 |
| 2020 | $2,673 | $208,703 | $67,404 | $141,299 |
| 2019 | $2,622 | $204,612 | $66,083 | $138,529 |
| 2018 | $2,573 | $200,601 | $64,788 | $135,813 |
| 2017 | $2,432 | $196,668 | $63,518 | $133,150 |
| 2016 | $2,229 | $192,813 | $62,273 | $130,540 |
| 2015 | $2,192 | $189,918 | $61,338 | $128,580 |
| 2014 | $2,114 | $186,199 | $60,137 | $126,062 |
Source: Public Records
Map
Nearby Homes
- 5558 Prancing Deer Place
- 5920 Lone Pine Place
- 5920 Forked Horn Place
- 5930 Forked Horn Place
- 5940 Forked Horn Place
- 5995 Black Tail Place
- 2495 Maverick Way
- 1 Dry Canyon Rd
- 0 Maverick Way Unit NS25217169
- 0 Maverick Way Unit NS25217148
- 3 Maverick Way
- 5160 Needs Road Name
- 5095 White Tail Place
- 5035 Stagg Hill Place
- 7260 Shale Rock Rd
- 7050 Shale Rock Rd
- 6944 Union Rd
- 6980 Cabernet Rd
- 6825 E Highway 46
- 1975 Hidden Acre Ln
- 5714 Prancing Deer Place
- 5695 Silverado Place
- 5720 Prancing Deer Place
- 0 Prancing Deer Place Unit NS17241318
- 0 Prancing Deer Place Unit PR1067780
- 0 Prancing Deer Place Unit PR1072407
- 0 Prancing Deer Place Unit NS17152415
- 0 Prancing Deer Place Unit CRNS24098282
- 0 Prancing Deer Place Unit CRNS24203388
- 0 Prancing Deer Place Unit NS24098282
- 0 Prancing Deer Place Unit NS23060974
- 0 Prancing Deer Place Unit 987323
- 0 Prancing Deer Place Unit 701266
- 0 Prancing Deer Place Unit 1011419
- 0 Prancing Deer Place Unit 3267
- 0 Prancing Deer Place Unit 1030182
- 0 Prancing Deer Place Unit 1001985
- 0 Prancing Deer Place Unit 7606
- 0 Prancing Deer Place Unit 2685
- 0 Prancing Deer Place Unit 1865
Your Personal Tour Guide
Ask me questions while you tour the home.