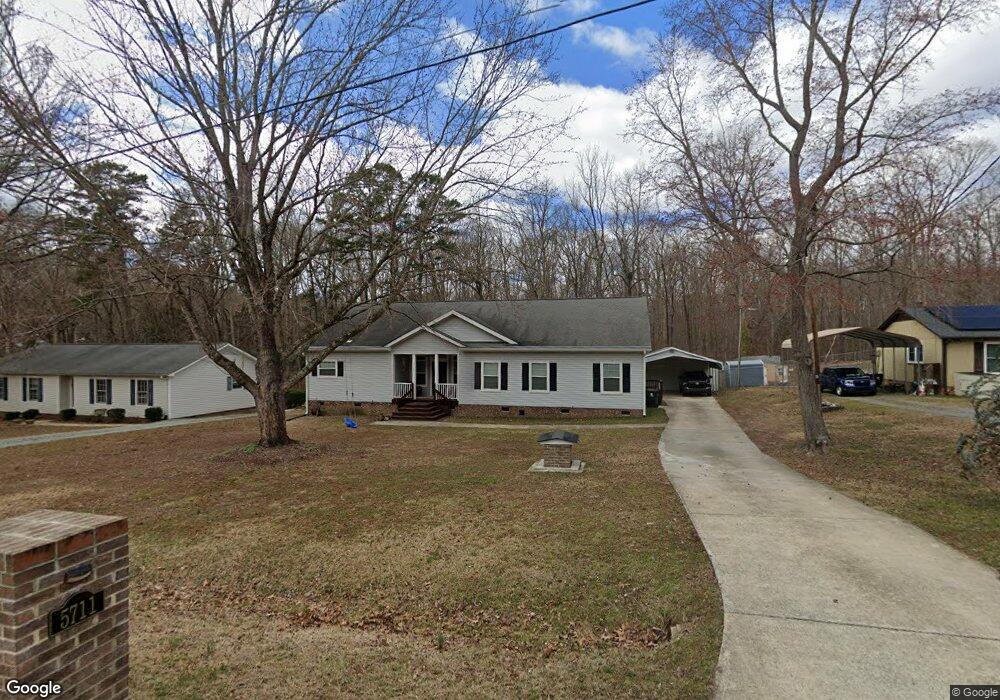
5711 Furman Ln Unit 11 Durham, NC 27712
Estimated Value: $365,000 - $468,000
3
Beds
3
Baths
2,561
Sq Ft
$167/Sq Ft
Est. Value
About This Home
This home is located at 5711 Furman Ln Unit 11, Durham, NC 27712 and is currently estimated at $428,805, approximately $167 per square foot. 5711 Furman Ln Unit 11 is a home located in Durham County with nearby schools including Little River Elementary School, Lucas Middle School, and Northern High School.
Ownership History
Date
Name
Owned For
Owner Type
Purchase Details
Closed on
Mar 18, 2015
Sold by
Morris Judy C and Full Michael E
Bought by
Full Judy C and Full Michael E
Current Estimated Value
Home Financials for this Owner
Home Financials are based on the most recent Mortgage that was taken out on this home.
Original Mortgage
$222,776
Outstanding Balance
$171,813
Interest Rate
3.87%
Mortgage Type
FHA
Estimated Equity
$256,992
Purchase Details
Closed on
Aug 25, 2009
Sold by
Wells Fargo Financial North Carolina I I
Bought by
Morris Judy C and Full Michael E
Home Financials for this Owner
Home Financials are based on the most recent Mortgage that was taken out on this home.
Original Mortgage
$234,179
Interest Rate
5.14%
Mortgage Type
Future Advance Clause Open End Mortgage
Purchase Details
Closed on
Feb 3, 2009
Sold by
Edwards Mark A and Tompkins Jodi E
Bought by
Wells Fargo Financial North Carolina 1 I
Create a Home Valuation Report for This Property
The Home Valuation Report is an in-depth analysis detailing your home's value as well as a comparison with similar homes in the area
Home Values in the Area
Average Home Value in this Area
Purchase History
| Date | Buyer | Sale Price | Title Company |
|---|---|---|---|
| Full Judy C | -- | Lenders Title And Escrow Llc | |
| Morris Judy C | $25,500 | None Available | |
| Wells Fargo Financial North Carolina 1 I | $150,000 | None Available |
Source: Public Records
Mortgage History
| Date | Status | Borrower | Loan Amount |
|---|---|---|---|
| Open | Full Judy C | $222,776 | |
| Previous Owner | Morris Judy C | $234,179 |
Source: Public Records
Tax History Compared to Growth
Tax History
| Year | Tax Paid | Tax Assessment Tax Assessment Total Assessment is a certain percentage of the fair market value that is determined by local assessors to be the total taxable value of land and additions on the property. | Land | Improvement |
|---|---|---|---|---|
| 2025 | $2,890 | $404,444 | $76,000 | $328,444 |
| 2024 | $2,633 | $257,967 | $30,480 | $227,487 |
| 2023 | $2,497 | $257,967 | $30,480 | $227,487 |
| 2022 | $2,399 | $257,967 | $30,480 | $227,487 |
| 2021 | $2,186 | $257,967 | $30,480 | $227,487 |
| 2020 | $2,141 | $257,967 | $30,480 | $227,487 |
| 2019 | $2,141 | $257,967 | $30,480 | $227,487 |
| 2018 | $1,949 | $218,114 | $26,670 | $191,444 |
| 2017 | $1,927 | $218,114 | $26,670 | $191,444 |
| 2016 | $1,845 | $218,114 | $26,670 | $191,444 |
| 2015 | $2,223 | $231,622 | $28,133 | $203,489 |
| 2014 | $2,223 | $231,622 | $28,133 | $203,489 |
Source: Public Records
Map
Nearby Homes
- 5940 N Roxboro Rd
- 309 Smith Dr
- 314 Smith Dr
- 155 Smith Dr
- 904 Snow Hill Rd
- 5703 Altrada Dr
- 5500 Novaglen Rd
- 206 Epperson Dr
- 404 Goodwin Rd
- 6119 Baird St
- 19 Northern Way Ct
- 512 W Bywood Dr
- 6 Blake Ct
- 115 Macwood Dr
- 312 Mason Rd
- 5805 Prioress Dr
- 5809 Prioress Dr
- 5801 Prioress Dr
- 1308 Snow Hill Rd
- 1302 Snow Hill Rd
- 5711 Furman Ln
- 5715 Furman Ln
- 5707 Furman Ln
- 5721 Furman Ln
- 5701 Furman Ln
- 500 Crievewood Dr
- 5725 Furman Ln
- 501 Crievewood Dr
- 505 Sandlewood Dr
- 5716 Furman Ln
- 501 Sandlewood Dr
- 5729 Furman Ln
- 815 Sandlewood Dr
- 510 Crievewood Dr
- 5733 Furman Ln
- 411 Sandlewood Dr
- 502 Sandlewood Dr
- 825 Sandlewood Dr
- 508 Sandlewood Dr
- 407 Sandlewood Dr